| Tabulation of Results | ||
| Weeks x Useful | ||
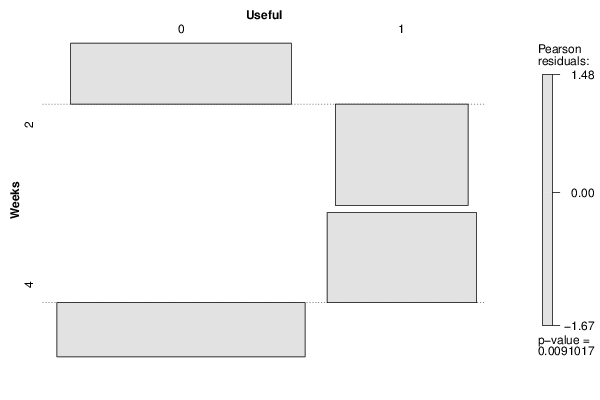
| 0 | 1 | 2 | 57 | 11 | 4 | 56 | 30 |
| Tabulation of Expected Results | ||
| Weeks x Useful | ||
| 0 | 1 | 2 | 49.9 | 18.1 | 4 | 63.1 | 22.9 |
| Statistical Results | |
| Pearson's Chi-squared test with Yates' continuity correction | |
| Pearson Chi Square Statistic | 5.88 |
| Degrees of Freedom | 1 |
| P value | 0.02 |