| Tabulation of Results | |||
| Weeks x T40 | |||
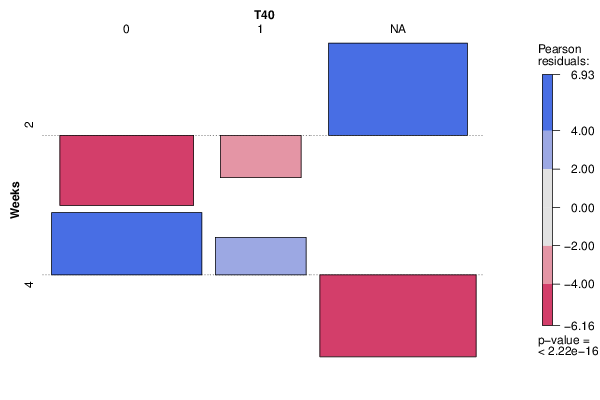
| 0 | 1 | NA | 2 | 0 | 0 | 68 | 4 | 63 | 23 | 0 |
| Tabulation of Expected Results | |||
| Weeks x T40 | |||
| 0 | 1 | NA | 2 | 27.82 | 10.16 | 30.03 | 4 | 35.18 | 12.84 | 37.97 |
| Statistical Results | |
| Pearson's Chi-squared test | |
| Pearson Chi Square Statistic | 154 |
| Degrees of Freedom | 2 |
| P value | 0 |