| Tabulation of Results | |||
| Weeks x T20 | |||
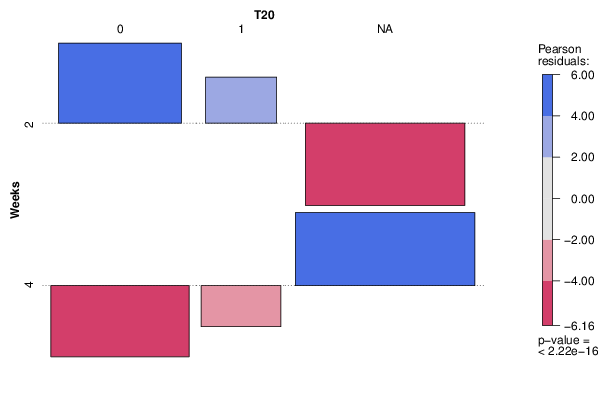
| 0 | 1 | NA | 2 | 51 | 17 | 0 | 4 | 0 | 0 | 86 |
| Tabulation of Expected Results | |||
| Weeks x T20 | |||
| 0 | 1 | NA | 2 | 22.52 | 7.51 | 37.97 | 4 | 28.48 | 9.49 | 48.03 |
| Statistical Results | |
| Pearson's Chi-squared test | |
| Pearson Chi Square Statistic | 154 |
| Degrees of Freedom | 2 |
| P value | 0 |