| Multiple Linear Regression - Estimated Regression Equation |
| CorrectAnalysis[t] = + 0.0342091785256804 + 0.00703473203162012UseLimit[t] -0.165833400963344T20[t] + 0.258868076514766Used[t] -0.0221823235624419Useful[t] -0.0260285290801734`Outcome\r`[t] + e[t] |
| Multiple Linear Regression - Ordinary Least Squares | |||||
| Variable | Parameter | S.D. | T-STAT H0: parameter = 0 | 2-tail p-value | 1-tail p-value |
| (Intercept) | 0.0342091785256804 | 0.036606 | 0.9345 | 0.353717 | 0.176858 |
| UseLimit | 0.00703473203162012 | 0.049811 | 0.1412 | 0.888155 | 0.444078 |
| T20 | -0.165833400963344 | 0.058908 | -2.8151 | 0.006556 | 0.003278 |
| Used | 0.258868076514766 | 0.063587 | 4.0711 | 0.000137 | 6.8e-05 |
| Useful | -0.0221823235624419 | 0.065011 | -0.3412 | 0.73412 | 0.36706 |
| `Outcome\r` | -0.0260285290801734 | 0.050549 | -0.5149 | 0.608469 | 0.304234 |
| Multiple Linear Regression - Regression Statistics | |
| Multiple R | 0.498022418485476 |
| R-squared | 0.248026329314123 |
| Adjusted R-squared | 0.18638914319233 |
| F-TEST (value) | 4.02397229529639 |
| F-TEST (DF numerator) | 5 |
| F-TEST (DF denominator) | 61 |
| p-value | 0.00320542835937931 |
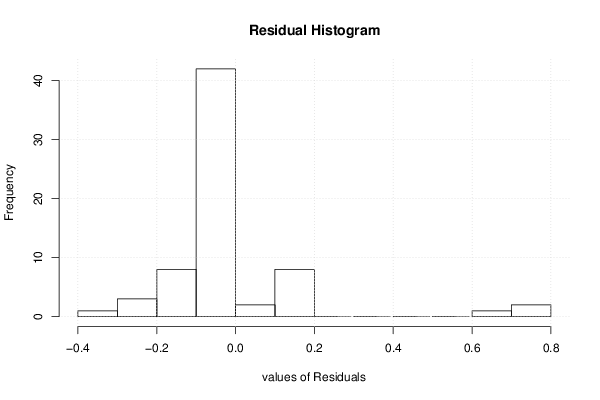
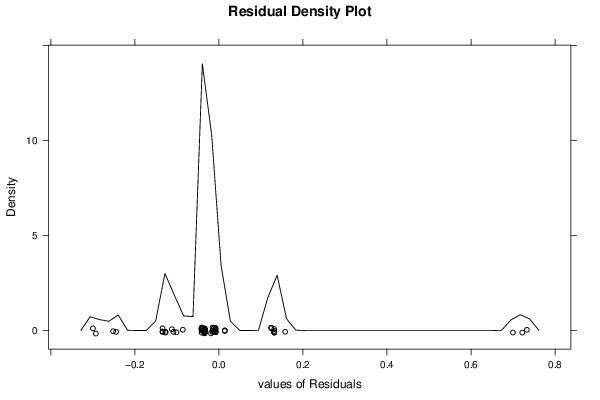
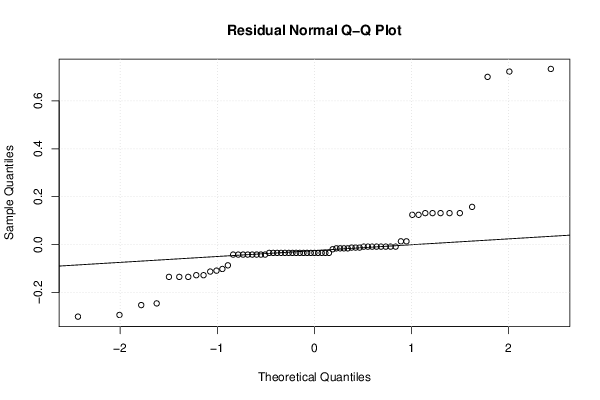
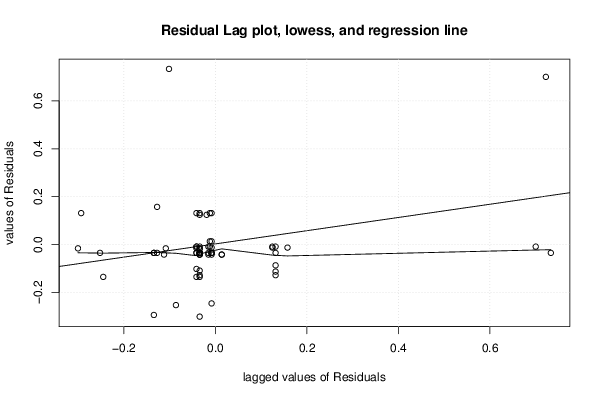
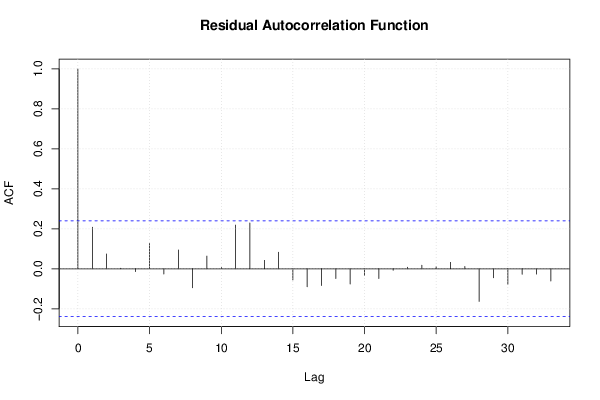
| Multiple Linear Regression - Residual Statistics | |
| Residual Standard Deviation | 0.187953151795345 |
| Sum Squared Residuals | 2.15490962345804 |
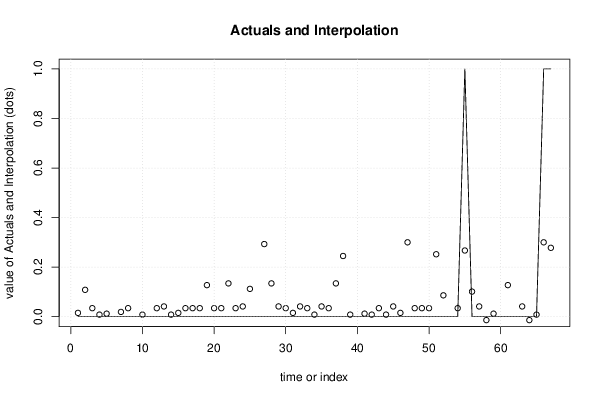
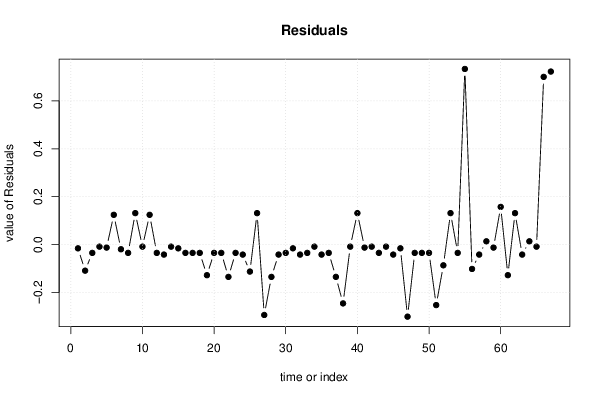
| Multiple Linear Regression - Actuals, Interpolation, and Residuals | |||
| Time or Index | Actuals | Interpolation Forecast | Residuals Prediction Error |
| 1 | 0 | 0.0152153814771272 | -0.0152153814771272 |
| 2 | 0 | 0.108250057028549 | -0.108250057028549 |
| 3 | 0 | 0.0342091785256803 | -0.0342091785256803 |
| 4 | 0 | 0.00818064944550692 | -0.00818064944550692 |
| 5 | 0 | 0.0120268549632385 | -0.0120268549632385 |
| 6 | 0 | -0.124589490406043 | 0.124589490406043 |
| 7 | 0 | 0.0190615869948587 | -0.0190615869948587 |
| 8 | 0 | 0.0342091785256804 | -0.0342091785256804 |
| 9 | 0 | -0.131624222437663 | 0.131624222437663 |
| 10 | 0 | 0.00818064944550704 | -0.00818064944550704 |
| 11 | 0 | -0.124589490406043 | 0.124589490406043 |
| 12 | 0 | 0.0342091785256804 | -0.0342091785256804 |
| 13 | 0 | 0.0412439105573005 | -0.0412439105573005 |
| 14 | 0 | 0.00818064944550704 | -0.00818064944550704 |
| 15 | 0 | 0.0152153814771272 | -0.0152153814771272 |
| 16 | 0 | 0.0342091785256804 | -0.0342091785256804 |
| 17 | 0 | 0.0342091785256804 | -0.0342091785256804 |
| 18 | 0 | 0.0342091785256804 | -0.0342091785256804 |
| 19 | 0 | 0.127243854077103 | -0.127243854077103 |
| 20 | 0 | 0.0342091785256804 | -0.0342091785256804 |
| 21 | 0 | 0.0342091785256804 | -0.0342091785256804 |
| 22 | 0 | 0.134278586108723 | -0.134278586108723 |
| 23 | 0 | 0.0342091785256804 | -0.0342091785256804 |
| 24 | 0 | 0.0412439105573005 | -0.0412439105573005 |
| 25 | 0 | 0.112096262546281 | -0.112096262546281 |
| 26 | 0 | -0.131624222437663 | 0.131624222437663 |
| 27 | 0 | 0.293077255040446 | -0.293077255040446 |
| 28 | 0 | 0.134278586108723 | -0.134278586108723 |
| 29 | 0 | 0.0412439105573005 | -0.0412439105573005 |
| 30 | 0 | 0.0342091785256804 | -0.0342091785256804 |
| 31 | 0 | 0.0152153814771272 | -0.0152153814771272 |
| 32 | 0 | 0.0412439105573005 | -0.0412439105573005 |
| 33 | 0 | 0.0342091785256804 | -0.0342091785256804 |
| 34 | 0 | 0.00818064944550704 | -0.00818064944550704 |
| 35 | 0 | 0.0412439105573005 | -0.0412439105573005 |
| 36 | 0 | 0.0342091785256804 | -0.0342091785256804 |
| 37 | 0 | 0.134278586108723 | -0.134278586108723 |
| 38 | 0 | 0.244866402397831 | -0.244866402397831 |
| 39 | 0 | 0.00818064944550704 | -0.00818064944550704 |
| 40 | 0 | -0.131624222437663 | 0.131624222437663 |
| 41 | 0 | 0.0120268549632385 | -0.0120268549632385 |
| 42 | 0 | 0.00818064944550704 | -0.00818064944550704 |
| 43 | 0 | 0.0342091785256804 | -0.0342091785256804 |
| 44 | 0 | 0.00818064944550704 | -0.00818064944550704 |
| 45 | 0 | 0.0412439105573005 | -0.0412439105573005 |
| 46 | 0 | 0.0152153814771272 | -0.0152153814771272 |
| 47 | 0 | 0.300111987072067 | -0.300111987072067 |
| 48 | 0 | 0.0342091785256804 | -0.0342091785256804 |
| 49 | 0 | 0.0342091785256804 | -0.0342091785256804 |
| 50 | 0 | 0.0342091785256804 | -0.0342091785256804 |
| 51 | 0 | 0.251901134429451 | -0.251901134429451 |
| 52 | 0 | 0.0860677334661075 | -0.0860677334661075 |
| 53 | 0 | -0.131624222437663 | 0.131624222437663 |
| 54 | 0 | 0.0342091785256804 | -0.0342091785256804 |
| 55 | 1 | 0.267048725960273 | 0.732951274039727 |
| 56 | 0 | 0.101215324996929 | -0.101215324996929 |
| 57 | 0 | 0.0412439105573005 | -0.0412439105573005 |
| 58 | 0 | -0.0140016741169348 | 0.0140016741169348 |
| 59 | 0 | 0.0120268549632385 | -0.0120268549632385 |
| 60 | 0 | -0.157652751517837 | 0.157652751517837 |
| 61 | 0 | 0.127243854077103 | -0.127243854077103 |
| 62 | 0 | -0.131624222437663 | 0.131624222437663 |
| 63 | 0 | 0.0412439105573005 | -0.0412439105573005 |
| 64 | 0 | -0.0140016741169348 | 0.0140016741169348 |
| 65 | 0 | 0.00818064944550704 | -0.00818064944550704 |
| 66 | 1 | 0.300111987072066 | 0.699888012927934 |
| 67 | 1 | 0.277929663509625 | 0.722070336490375 |
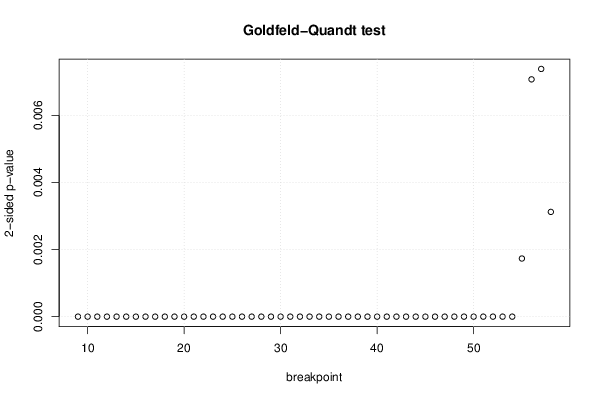
| Goldfeld-Quandt test for Heteroskedasticity | |||
| p-values | Alternative Hypothesis | ||
| breakpoint index | greater | 2-sided | less |
| 9 | 0 | 0 | 1 |
| 10 | 0 | 0 | 1 |
| 11 | 0 | 0 | 1 |
| 12 | 0 | 0 | 1 |
| 13 | 0 | 0 | 1 |
| 14 | 0 | 0 | 1 |
| 15 | 0 | 0 | 1 |
| 16 | 0 | 0 | 1 |
| 17 | 0 | 0 | 1 |
| 18 | 0 | 0 | 1 |
| 19 | 0 | 0 | 1 |
| 20 | 0 | 0 | 1 |
| 21 | 0 | 0 | 1 |
| 22 | 0 | 0 | 1 |
| 23 | 0 | 0 | 1 |
| 24 | 0 | 0 | 1 |
| 25 | 0 | 0 | 1 |
| 26 | 0 | 0 | 1 |
| 27 | 0 | 0 | 1 |
| 28 | 0 | 0 | 1 |
| 29 | 0 | 0 | 1 |
| 30 | 0 | 0 | 1 |
| 31 | 0 | 0 | 1 |
| 32 | 0 | 0 | 1 |
| 33 | 0 | 0 | 1 |
| 34 | 0 | 0 | 1 |
| 35 | 0 | 0 | 1 |
| 36 | 0 | 0 | 1 |
| 37 | 0 | 0 | 1 |
| 38 | 0 | 0 | 1 |
| 39 | 0 | 0 | 1 |
| 40 | 0 | 0 | 1 |
| 41 | 0 | 0 | 1 |
| 42 | 0 | 0 | 1 |
| 43 | 0 | 0 | 1 |
| 44 | 0 | 0 | 1 |
| 45 | 0 | 0 | 1 |
| 46 | 0 | 0 | 1 |
| 47 | 0 | 0 | 1 |
| 48 | 0 | 0 | 1 |
| 49 | 0 | 0 | 1 |
| 50 | 0 | 0 | 1 |
| 51 | 0 | 0 | 1 |
| 52 | 0 | 0 | 1 |
| 53 | 0 | 0 | 1 |
| 54 | 0 | 0 | 1 |
| 55 | 0.000866206572833931 | 0.00173241314566786 | 0.999133793427166 |
| 56 | 0.00353532595022659 | 0.00707065190045317 | 0.996464674049773 |
| 57 | 0.00369019460789596 | 0.00738038921579192 | 0.996309805392104 |
| 58 | 0.0015606118560831 | 0.0031212237121662 | 0.998439388143917 |
| Meta Analysis of Goldfeld-Quandt test for Heteroskedasticity | |||
| Description | # significant tests | % significant tests | OK/NOK |
| 1% type I error level | 50 | 1 | NOK |
| 5% type I error level | 50 | 1 | NOK |
| 10% type I error level | 50 | 1 | NOK |