| Tabulation of Results | ||
| Weeks x T40 | ||
| 0 | 1 | 2 | 0 | 0 | 4 | 63 | 23 |
| Tabulation of Expected Results | ||
| Weeks x T40 | ||
| 0 | 1 | 2 | 0 | 0 | 4 | 63 | 23 |
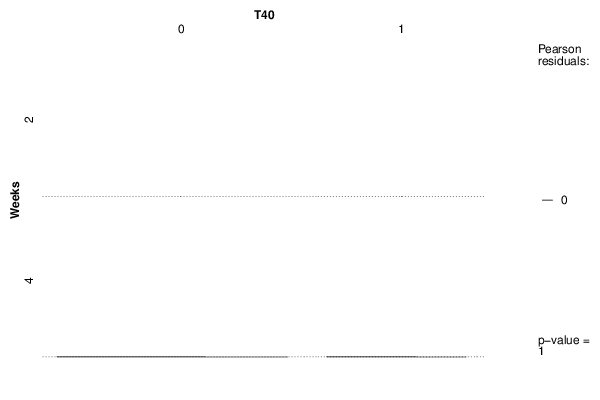
| Statistical Results | |
| Pearson's Chi-squared test | |
| Pearson Chi Square Statistic | NaN |
| Degrees of Freedom | 1 |
| P value | NaN |
| Tabulation of Results | ||
| Weeks x T40 | ||
| 0 | 1 | 2 | 0 | 0 | 4 | 63 | 23 |
| Tabulation of Expected Results | ||
| Weeks x T40 | ||
| 0 | 1 | 2 | 0 | 0 | 4 | 63 | 23 |
| Statistical Results | |
| Pearson's Chi-squared test | |
| Pearson Chi Square Statistic | NaN |
| Degrees of Freedom | 1 |
| P value | NaN |