Free Statistics

of Irreproducible Research!

Author's title

Author*The author of this computation has been verified*
R Software Modulerwasp_multipleregression.wasp
Title produced by softwareMultiple Regression
Date of computationSun, 16 Dec 2012 09:17:18 -0500
Cite this page as followsStatistical Computations at FreeStatistics.org, Office for Research Development and Education, URL https://freestatistics.org/blog/index.php?v=date/2012/Dec/16/t1355667915ljkq9lkgiyngy0y.htm/, Retrieved Tue, 16 Apr 2024 05:40:17 +0000
Statistical Computations at FreeStatistics.org, Office for Research Development and Education, URL https://freestatistics.org/blog/index.php?pk=200378, Retrieved Tue, 16 Apr 2024 05:40:17 +0000
QR Codes:

Original text written by user:
IsPrivate?No (this computation is public)
User-defined keywords
Estimated Impact83
Family? (F = Feedback message, R = changed R code, M = changed R Module, P = changed Parameters, D = changed Data)
-       [Multiple Regression] [] [2012-12-16 14:17:18] [843149dd24ea3aaab20d8c5630e75083] [Current]
Feedback Forum

Post a new message
Dataseries X:
7.1	426	3.2	24776
7.2	396	2.9	19814
7.2	458	2.7	12738
7.1	315	3.1	31566
6.9	337	2.7	30111
6.8	386	2.6	30019
6.8	352	1.8	31934
6.8	384	2.3	25826
6.9	439	2.2	26835
7.1	397	1.8	20205
7.2	453	1.4	17789
7.2	364	0.3	20520
7.1	367	0.8	22518
7.1	474	-0.5	15572
7.2	373	-2.2	11509
7.5	404	-2.9	25447
7.7	385	-5.1	24090
7.8	365	-7.2	27786
7.7	366	-7.9	26195
7.7	421	-10.9	20516
7.8	354	-12.7	22759
8	367	-14	19028
8.1	413	-15.6	16971
8.1	362	-16	20036
8	385	-17.2	22485
8.1	343	-17.6	18730
8.2	369	-15.5	14538
8.4	363	-13.7	27561
8.5	318	-11.4	25985
8.5	393	-9.2	34670
8.5	325	-6.3	32066
8.5	403	-3.1	27186
8.5	392	0	29586
8.4	409	3	21359
8.3	485	5.4	21553
8.2	423	7.6	19573
8.1	428	9.7	24256
7.9	431	12	22380
7.6	416	11.6	16167
7.3	330	10	27297
7.1	314	10.8	28287
7	345	11.3	33474
7.1	365	10.1	28229
7.1	417	9.4	28785
7.1	356	9.6	25597
7.3	477	7.9	18130
7.3	423	7.3	20198
7.3	386	6.2	22849
7.2	390	4.9	23118
7.2	407	3.6	21925
7.1	398	2.9	20801
7.1	327	3.1	18785
7.1	304	1.7	20659
7.2	378	0.6	29367
7.3	311	-0.4	23992
7.4	376	-1.1	20645
7.4	340	-2.9	22356
7.5	383	-2.8	17902
7.4	467	-3	15879
7.4	439	-3.2	16963


Summary of computational transaction
Raw Inputview raw input (R code)
Raw Outputview raw output of R engine
Computing time9 seconds
R Server'Gwilym Jenkins' @ jenkins.wessa.net

\begin{tabular}{lllllllll}
\hline
Summary of computational transaction \tabularnewline
Raw Input & view raw input (R code)  \tabularnewline
Raw Output & view raw output of R engine  \tabularnewline
Computing time & 9 seconds \tabularnewline
R Server & 'Gwilym Jenkins' @ jenkins.wessa.net \tabularnewline
\hline
\end{tabular}
%Source: https://freestatistics.org/blog/index.php?pk=200378&T=0

[TABLE]
[ROW][C]Summary of computational transaction[/C][/ROW]
[ROW][C]Raw Input[/C][C]view raw input (R code) [/C][/ROW]
[ROW][C]Raw Output[/C][C]view raw output of R engine [/C][/ROW]
[ROW][C]Computing time[/C][C]9 seconds[/C][/ROW]
[ROW][C]R Server[/C][C]'Gwilym Jenkins' @ jenkins.wessa.net[/C][/ROW]
[/TABLE]
Source: https://freestatistics.org/blog/index.php?pk=200378&T=0

Globally Unique Identifier (entire table): ba.freestatistics.org/blog/index.php?pk=200378&T=0

As an alternative you can also use a QR Code:  

The GUIDs for individual cells are displayed in the table below:

Summary of computational transaction
Raw Inputview raw input (R code)
Raw Outputview raw output of R engine
Computing time9 seconds
R Server'Gwilym Jenkins' @ jenkins.wessa.net


Multiple Linear Regression - Estimated Regression Equation
werkloosheidsgraad[t] = + 6.01453340353181 + 0.00273851376243852bouwvergunningen[t] -0.0384193212797573uitvoer[t] + 1.90004686501017e-05personenwagens[t] + e[t]

\begin{tabular}{lllllllll}
\hline
Multiple Linear Regression - Estimated Regression Equation \tabularnewline
werkloosheidsgraad[t] =  +  6.01453340353181 +  0.00273851376243852bouwvergunningen[t] -0.0384193212797573uitvoer[t] +  1.90004686501017e-05personenwagens[t]  + e[t] \tabularnewline
\hline
\end{tabular}
%Source: https://freestatistics.org/blog/index.php?pk=200378&T=1

[TABLE]
[ROW][C]Multiple Linear Regression - Estimated Regression Equation[/C][/ROW]
[ROW][C]werkloosheidsgraad[t] =  +  6.01453340353181 +  0.00273851376243852bouwvergunningen[t] -0.0384193212797573uitvoer[t] +  1.90004686501017e-05personenwagens[t]  + e[t][/C][/ROW]
[/TABLE]
Source: https://freestatistics.org/blog/index.php?pk=200378&T=1

Globally Unique Identifier (entire table): ba.freestatistics.org/blog/index.php?pk=200378&T=1

As an alternative you can also use a QR Code:  

The GUIDs for individual cells are displayed in the table below:

Multiple Linear Regression - Estimated Regression Equation
werkloosheidsgraad[t] = + 6.01453340353181 + 0.00273851376243852bouwvergunningen[t] -0.0384193212797573uitvoer[t] + 1.90004686501017e-05personenwagens[t] + e[t]


Multiple Linear Regression - Ordinary Least Squares
VariableParameterS.D.T-STATH0: parameter = 02-tail p-value1-tail p-value
(Intercept)6.014533403531810.7556117.959800
bouwvergunningen0.002738513762438520.0014891.83920.0711850.035592
uitvoer-0.03841932127975730.007471-5.14224e-062e-06
personenwagens1.90004686501017e-051.2e-051.53250.1310250.065512

\begin{tabular}{lllllllll}
\hline
Multiple Linear Regression - Ordinary Least Squares \tabularnewline
Variable & Parameter & S.D. & T-STATH0: parameter = 0 & 2-tail p-value & 1-tail p-value \tabularnewline
(Intercept) & 6.01453340353181 & 0.755611 & 7.9598 & 0 & 0 \tabularnewline
bouwvergunningen & 0.00273851376243852 & 0.001489 & 1.8392 & 0.071185 & 0.035592 \tabularnewline
uitvoer & -0.0384193212797573 & 0.007471 & -5.1422 & 4e-06 & 2e-06 \tabularnewline
personenwagens & 1.90004686501017e-05 & 1.2e-05 & 1.5325 & 0.131025 & 0.065512 \tabularnewline
\hline
\end{tabular}
%Source: https://freestatistics.org/blog/index.php?pk=200378&T=2

[TABLE]
[ROW][C]Multiple Linear Regression - Ordinary Least Squares[/C][/ROW]
[ROW][C]Variable[/C][C]Parameter[/C][C]S.D.[/C][C]T-STATH0: parameter = 0[/C][C]2-tail p-value[/C][C]1-tail p-value[/C][/ROW]
[ROW][C](Intercept)[/C][C]6.01453340353181[/C][C]0.755611[/C][C]7.9598[/C][C]0[/C][C]0[/C][/ROW]
[ROW][C]bouwvergunningen[/C][C]0.00273851376243852[/C][C]0.001489[/C][C]1.8392[/C][C]0.071185[/C][C]0.035592[/C][/ROW]
[ROW][C]uitvoer[/C][C]-0.0384193212797573[/C][C]0.007471[/C][C]-5.1422[/C][C]4e-06[/C][C]2e-06[/C][/ROW]
[ROW][C]personenwagens[/C][C]1.90004686501017e-05[/C][C]1.2e-05[/C][C]1.5325[/C][C]0.131025[/C][C]0.065512[/C][/ROW]
[/TABLE]
Source: https://freestatistics.org/blog/index.php?pk=200378&T=2

Globally Unique Identifier (entire table): ba.freestatistics.org/blog/index.php?pk=200378&T=2

As an alternative you can also use a QR Code:  

The GUIDs for individual cells are displayed in the table below:

Multiple Linear Regression - Ordinary Least Squares
VariableParameterS.D.T-STATH0: parameter = 02-tail p-value1-tail p-value
(Intercept)6.014533403531810.7556117.959800
bouwvergunningen0.002738513762438520.0014891.83920.0711850.035592
uitvoer-0.03841932127975730.007471-5.14224e-062e-06
personenwagens1.90004686501017e-051.2e-051.53250.1310250.065512


Multiple Linear Regression - Regression Statistics
Multiple R0.567738572912336
R-squared0.322327087172535
Adjusted R-squared0.286023181128207
F-TEST (value)8.87857870662627
F-TEST (DF numerator)3
F-TEST (DF denominator)56
p-value6.59891388756773e-05
Multiple Linear Regression - Residual Statistics
Residual Standard Deviation0.43894750687935
Sum Squared Residuals10.7897951725534

\begin{tabular}{lllllllll}
\hline
Multiple Linear Regression - Regression Statistics \tabularnewline
Multiple R & 0.567738572912336 \tabularnewline
R-squared & 0.322327087172535 \tabularnewline
Adjusted R-squared & 0.286023181128207 \tabularnewline
F-TEST (value) & 8.87857870662627 \tabularnewline
F-TEST (DF numerator) & 3 \tabularnewline
F-TEST (DF denominator) & 56 \tabularnewline
p-value & 6.59891388756773e-05 \tabularnewline
Multiple Linear Regression - Residual Statistics \tabularnewline
Residual Standard Deviation & 0.43894750687935 \tabularnewline
Sum Squared Residuals & 10.7897951725534 \tabularnewline
\hline
\end{tabular}
%Source: https://freestatistics.org/blog/index.php?pk=200378&T=3

[TABLE]
[ROW][C]Multiple Linear Regression - Regression Statistics[/C][/ROW]
[ROW][C]Multiple R[/C][C]0.567738572912336[/C][/ROW]
[ROW][C]R-squared[/C][C]0.322327087172535[/C][/ROW]
[ROW][C]Adjusted R-squared[/C][C]0.286023181128207[/C][/ROW]
[ROW][C]F-TEST (value)[/C][C]8.87857870662627[/C][/ROW]
[ROW][C]F-TEST (DF numerator)[/C][C]3[/C][/ROW]
[ROW][C]F-TEST (DF denominator)[/C][C]56[/C][/ROW]
[ROW][C]p-value[/C][C]6.59891388756773e-05[/C][/ROW]
[ROW][C]Multiple Linear Regression - Residual Statistics[/C][/ROW]
[ROW][C]Residual Standard Deviation[/C][C]0.43894750687935[/C][/ROW]
[ROW][C]Sum Squared Residuals[/C][C]10.7897951725534[/C][/ROW]
[/TABLE]
Source: https://freestatistics.org/blog/index.php?pk=200378&T=3

Globally Unique Identifier (entire table): ba.freestatistics.org/blog/index.php?pk=200378&T=3

As an alternative you can also use a QR Code:  

The GUIDs for individual cells are displayed in the table below:

Multiple Linear Regression - Regression Statistics
Multiple R0.567738572912336
R-squared0.322327087172535
Adjusted R-squared0.286023181128207
F-TEST (value)8.87857870662627
F-TEST (DF numerator)3
F-TEST (DF denominator)56
p-value6.59891388756773e-05
Multiple Linear Regression - Residual Statistics
Residual Standard Deviation0.43894750687935
Sum Squared Residuals10.7897951725534


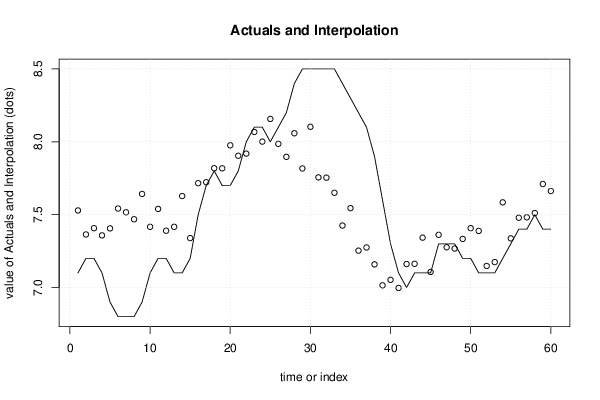
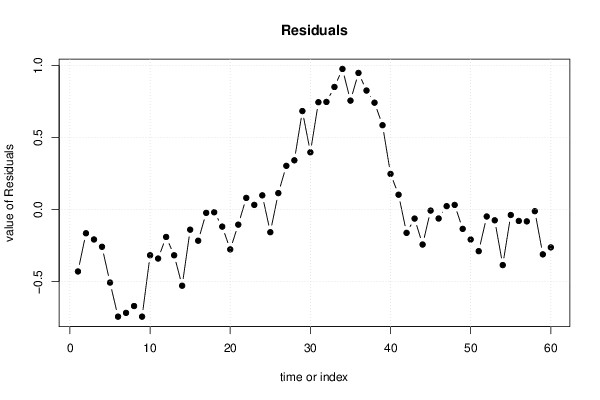
Multiple Linear Regression - Actuals, Interpolation, and Residuals
Time or IndexActualsInterpolationForecastResidualsPrediction Error
17.17.5289540495103-0.428954049510305
27.27.36404410757928-0.16404410757928
37.27.4070685089383-0.2070685089383
47.17.3578341361418-0.257834136141803
56.97.40580348554146-0.505803485541455
66.87.54208454891311-0.74208454891311
76.87.51609643547895-0.716096435478951
86.87.46846435272228-0.668464352722284
96.97.64209601465233-0.74209601465233
107.17.41647305799164-0.316473057991642
117.27.53929242494146-0.339292424941456
127.27.38971623337559-0.189716233375588
137.17.41668505038593-0.316685050385929
147.17.62767388538693-0.527673885386929
157.27.33919793743086-0.139197937430862
167.57.7158139210074-0.215813921007403
177.77.72252103037835-0.0225210303783494
187.87.81865706194785-0.0186570619478455
197.77.8180593549838-0.118059354983802
207.77.97603191429327-0.276031914293265
217.87.90432432169563-0.104324321695626
2287.918979369737480.0810206302625181
238.18.067337952844010.0326620471559932
248.18.001277915884110.0987220841158932
2588.15689906568-0.15689906568
268.17.985902456388350.114097543611646
278.27.896773274943040.303226725056961
288.48.058630517295120.341369482704882
298.57.817088220449380.682911779550617
308.58.102973316042940.397026683957062
318.57.755861128120960.744138871879042
328.57.753801086483440.746198913516557
338.57.650178663889620.849821336110384
348.47.425158578427410.974841421572588
358.37.544765344219440.755234655780559
368.27.252834056205590.947165943794413
378.17.274825245018710.825174754981285
387.97.1590314681750.740968531825003
397.67.015271578527240.584728421472759
407.37.052705525080770.247294474919229
417.16.996964311821550.10303568817845
4277.16120400870534-0.161204008705342
437.17.16242001142004-0.0624200114200389
447.17.34228051253213-0.242280512532129
457.17.1069738147109-0.00697381471090333
467.37.36177032673124-0.0617703267312427
477.37.276235145495830.0237648545041729
487.37.267541632084750.0324583679152456
497.27.33355193086507-0.13355193086507
507.27.40738422339064-0.207384223390638
517.17.38827459766181-0.288274597661808
527.17.14785131147412-0.0478513114741164
537.17.17425942297998-0.0742594229799812
547.27.58462677581325-0.384626775813249
557.37.33743815601533-0.0374381560153299
567.47.47874050689777-0.0787405068977731
577.47.48181859161387-0.0818185916138734
587.57.5111046639032-0.0111046639032017
597.47.71038573612483-0.310385736124833
607.47.66198772304922-0.261987723049216

\begin{tabular}{lllllllll}
\hline
Multiple Linear Regression - Actuals, Interpolation, and Residuals \tabularnewline
Time or Index & Actuals & InterpolationForecast & ResidualsPrediction Error \tabularnewline
1 & 7.1 & 7.5289540495103 & -0.428954049510305 \tabularnewline
2 & 7.2 & 7.36404410757928 & -0.16404410757928 \tabularnewline
3 & 7.2 & 7.4070685089383 & -0.2070685089383 \tabularnewline
4 & 7.1 & 7.3578341361418 & -0.257834136141803 \tabularnewline
5 & 6.9 & 7.40580348554146 & -0.505803485541455 \tabularnewline
6 & 6.8 & 7.54208454891311 & -0.74208454891311 \tabularnewline
7 & 6.8 & 7.51609643547895 & -0.716096435478951 \tabularnewline
8 & 6.8 & 7.46846435272228 & -0.668464352722284 \tabularnewline
9 & 6.9 & 7.64209601465233 & -0.74209601465233 \tabularnewline
10 & 7.1 & 7.41647305799164 & -0.316473057991642 \tabularnewline
11 & 7.2 & 7.53929242494146 & -0.339292424941456 \tabularnewline
12 & 7.2 & 7.38971623337559 & -0.189716233375588 \tabularnewline
13 & 7.1 & 7.41668505038593 & -0.316685050385929 \tabularnewline
14 & 7.1 & 7.62767388538693 & -0.527673885386929 \tabularnewline
15 & 7.2 & 7.33919793743086 & -0.139197937430862 \tabularnewline
16 & 7.5 & 7.7158139210074 & -0.215813921007403 \tabularnewline
17 & 7.7 & 7.72252103037835 & -0.0225210303783494 \tabularnewline
18 & 7.8 & 7.81865706194785 & -0.0186570619478455 \tabularnewline
19 & 7.7 & 7.8180593549838 & -0.118059354983802 \tabularnewline
20 & 7.7 & 7.97603191429327 & -0.276031914293265 \tabularnewline
21 & 7.8 & 7.90432432169563 & -0.104324321695626 \tabularnewline
22 & 8 & 7.91897936973748 & 0.0810206302625181 \tabularnewline
23 & 8.1 & 8.06733795284401 & 0.0326620471559932 \tabularnewline
24 & 8.1 & 8.00127791588411 & 0.0987220841158932 \tabularnewline
25 & 8 & 8.15689906568 & -0.15689906568 \tabularnewline
26 & 8.1 & 7.98590245638835 & 0.114097543611646 \tabularnewline
27 & 8.2 & 7.89677327494304 & 0.303226725056961 \tabularnewline
28 & 8.4 & 8.05863051729512 & 0.341369482704882 \tabularnewline
29 & 8.5 & 7.81708822044938 & 0.682911779550617 \tabularnewline
30 & 8.5 & 8.10297331604294 & 0.397026683957062 \tabularnewline
31 & 8.5 & 7.75586112812096 & 0.744138871879042 \tabularnewline
32 & 8.5 & 7.75380108648344 & 0.746198913516557 \tabularnewline
33 & 8.5 & 7.65017866388962 & 0.849821336110384 \tabularnewline
34 & 8.4 & 7.42515857842741 & 0.974841421572588 \tabularnewline
35 & 8.3 & 7.54476534421944 & 0.755234655780559 \tabularnewline
36 & 8.2 & 7.25283405620559 & 0.947165943794413 \tabularnewline
37 & 8.1 & 7.27482524501871 & 0.825174754981285 \tabularnewline
38 & 7.9 & 7.159031468175 & 0.740968531825003 \tabularnewline
39 & 7.6 & 7.01527157852724 & 0.584728421472759 \tabularnewline
40 & 7.3 & 7.05270552508077 & 0.247294474919229 \tabularnewline
41 & 7.1 & 6.99696431182155 & 0.10303568817845 \tabularnewline
42 & 7 & 7.16120400870534 & -0.161204008705342 \tabularnewline
43 & 7.1 & 7.16242001142004 & -0.0624200114200389 \tabularnewline
44 & 7.1 & 7.34228051253213 & -0.242280512532129 \tabularnewline
45 & 7.1 & 7.1069738147109 & -0.00697381471090333 \tabularnewline
46 & 7.3 & 7.36177032673124 & -0.0617703267312427 \tabularnewline
47 & 7.3 & 7.27623514549583 & 0.0237648545041729 \tabularnewline
48 & 7.3 & 7.26754163208475 & 0.0324583679152456 \tabularnewline
49 & 7.2 & 7.33355193086507 & -0.13355193086507 \tabularnewline
50 & 7.2 & 7.40738422339064 & -0.207384223390638 \tabularnewline
51 & 7.1 & 7.38827459766181 & -0.288274597661808 \tabularnewline
52 & 7.1 & 7.14785131147412 & -0.0478513114741164 \tabularnewline
53 & 7.1 & 7.17425942297998 & -0.0742594229799812 \tabularnewline
54 & 7.2 & 7.58462677581325 & -0.384626775813249 \tabularnewline
55 & 7.3 & 7.33743815601533 & -0.0374381560153299 \tabularnewline
56 & 7.4 & 7.47874050689777 & -0.0787405068977731 \tabularnewline
57 & 7.4 & 7.48181859161387 & -0.0818185916138734 \tabularnewline
58 & 7.5 & 7.5111046639032 & -0.0111046639032017 \tabularnewline
59 & 7.4 & 7.71038573612483 & -0.310385736124833 \tabularnewline
60 & 7.4 & 7.66198772304922 & -0.261987723049216 \tabularnewline
\hline
\end{tabular}
%Source: https://freestatistics.org/blog/index.php?pk=200378&T=4

[TABLE]
[ROW][C]Multiple Linear Regression - Actuals, Interpolation, and Residuals[/C][/ROW]
[ROW][C]Time or Index[/C][C]Actuals[/C][C]InterpolationForecast[/C][C]ResidualsPrediction Error[/C][/ROW]
[ROW][C]1[/C][C]7.1[/C][C]7.5289540495103[/C][C]-0.428954049510305[/C][/ROW]
[ROW][C]2[/C][C]7.2[/C][C]7.36404410757928[/C][C]-0.16404410757928[/C][/ROW]
[ROW][C]3[/C][C]7.2[/C][C]7.4070685089383[/C][C]-0.2070685089383[/C][/ROW]
[ROW][C]4[/C][C]7.1[/C][C]7.3578341361418[/C][C]-0.257834136141803[/C][/ROW]
[ROW][C]5[/C][C]6.9[/C][C]7.40580348554146[/C][C]-0.505803485541455[/C][/ROW]
[ROW][C]6[/C][C]6.8[/C][C]7.54208454891311[/C][C]-0.74208454891311[/C][/ROW]
[ROW][C]7[/C][C]6.8[/C][C]7.51609643547895[/C][C]-0.716096435478951[/C][/ROW]
[ROW][C]8[/C][C]6.8[/C][C]7.46846435272228[/C][C]-0.668464352722284[/C][/ROW]
[ROW][C]9[/C][C]6.9[/C][C]7.64209601465233[/C][C]-0.74209601465233[/C][/ROW]
[ROW][C]10[/C][C]7.1[/C][C]7.41647305799164[/C][C]-0.316473057991642[/C][/ROW]
[ROW][C]11[/C][C]7.2[/C][C]7.53929242494146[/C][C]-0.339292424941456[/C][/ROW]
[ROW][C]12[/C][C]7.2[/C][C]7.38971623337559[/C][C]-0.189716233375588[/C][/ROW]
[ROW][C]13[/C][C]7.1[/C][C]7.41668505038593[/C][C]-0.316685050385929[/C][/ROW]
[ROW][C]14[/C][C]7.1[/C][C]7.62767388538693[/C][C]-0.527673885386929[/C][/ROW]
[ROW][C]15[/C][C]7.2[/C][C]7.33919793743086[/C][C]-0.139197937430862[/C][/ROW]
[ROW][C]16[/C][C]7.5[/C][C]7.7158139210074[/C][C]-0.215813921007403[/C][/ROW]
[ROW][C]17[/C][C]7.7[/C][C]7.72252103037835[/C][C]-0.0225210303783494[/C][/ROW]
[ROW][C]18[/C][C]7.8[/C][C]7.81865706194785[/C][C]-0.0186570619478455[/C][/ROW]
[ROW][C]19[/C][C]7.7[/C][C]7.8180593549838[/C][C]-0.118059354983802[/C][/ROW]
[ROW][C]20[/C][C]7.7[/C][C]7.97603191429327[/C][C]-0.276031914293265[/C][/ROW]
[ROW][C]21[/C][C]7.8[/C][C]7.90432432169563[/C][C]-0.104324321695626[/C][/ROW]
[ROW][C]22[/C][C]8[/C][C]7.91897936973748[/C][C]0.0810206302625181[/C][/ROW]
[ROW][C]23[/C][C]8.1[/C][C]8.06733795284401[/C][C]0.0326620471559932[/C][/ROW]
[ROW][C]24[/C][C]8.1[/C][C]8.00127791588411[/C][C]0.0987220841158932[/C][/ROW]
[ROW][C]25[/C][C]8[/C][C]8.15689906568[/C][C]-0.15689906568[/C][/ROW]
[ROW][C]26[/C][C]8.1[/C][C]7.98590245638835[/C][C]0.114097543611646[/C][/ROW]
[ROW][C]27[/C][C]8.2[/C][C]7.89677327494304[/C][C]0.303226725056961[/C][/ROW]
[ROW][C]28[/C][C]8.4[/C][C]8.05863051729512[/C][C]0.341369482704882[/C][/ROW]
[ROW][C]29[/C][C]8.5[/C][C]7.81708822044938[/C][C]0.682911779550617[/C][/ROW]
[ROW][C]30[/C][C]8.5[/C][C]8.10297331604294[/C][C]0.397026683957062[/C][/ROW]
[ROW][C]31[/C][C]8.5[/C][C]7.75586112812096[/C][C]0.744138871879042[/C][/ROW]
[ROW][C]32[/C][C]8.5[/C][C]7.75380108648344[/C][C]0.746198913516557[/C][/ROW]
[ROW][C]33[/C][C]8.5[/C][C]7.65017866388962[/C][C]0.849821336110384[/C][/ROW]
[ROW][C]34[/C][C]8.4[/C][C]7.42515857842741[/C][C]0.974841421572588[/C][/ROW]
[ROW][C]35[/C][C]8.3[/C][C]7.54476534421944[/C][C]0.755234655780559[/C][/ROW]
[ROW][C]36[/C][C]8.2[/C][C]7.25283405620559[/C][C]0.947165943794413[/C][/ROW]
[ROW][C]37[/C][C]8.1[/C][C]7.27482524501871[/C][C]0.825174754981285[/C][/ROW]
[ROW][C]38[/C][C]7.9[/C][C]7.159031468175[/C][C]0.740968531825003[/C][/ROW]
[ROW][C]39[/C][C]7.6[/C][C]7.01527157852724[/C][C]0.584728421472759[/C][/ROW]
[ROW][C]40[/C][C]7.3[/C][C]7.05270552508077[/C][C]0.247294474919229[/C][/ROW]
[ROW][C]41[/C][C]7.1[/C][C]6.99696431182155[/C][C]0.10303568817845[/C][/ROW]
[ROW][C]42[/C][C]7[/C][C]7.16120400870534[/C][C]-0.161204008705342[/C][/ROW]
[ROW][C]43[/C][C]7.1[/C][C]7.16242001142004[/C][C]-0.0624200114200389[/C][/ROW]
[ROW][C]44[/C][C]7.1[/C][C]7.34228051253213[/C][C]-0.242280512532129[/C][/ROW]
[ROW][C]45[/C][C]7.1[/C][C]7.1069738147109[/C][C]-0.00697381471090333[/C][/ROW]
[ROW][C]46[/C][C]7.3[/C][C]7.36177032673124[/C][C]-0.0617703267312427[/C][/ROW]
[ROW][C]47[/C][C]7.3[/C][C]7.27623514549583[/C][C]0.0237648545041729[/C][/ROW]
[ROW][C]48[/C][C]7.3[/C][C]7.26754163208475[/C][C]0.0324583679152456[/C][/ROW]
[ROW][C]49[/C][C]7.2[/C][C]7.33355193086507[/C][C]-0.13355193086507[/C][/ROW]
[ROW][C]50[/C][C]7.2[/C][C]7.40738422339064[/C][C]-0.207384223390638[/C][/ROW]
[ROW][C]51[/C][C]7.1[/C][C]7.38827459766181[/C][C]-0.288274597661808[/C][/ROW]
[ROW][C]52[/C][C]7.1[/C][C]7.14785131147412[/C][C]-0.0478513114741164[/C][/ROW]
[ROW][C]53[/C][C]7.1[/C][C]7.17425942297998[/C][C]-0.0742594229799812[/C][/ROW]
[ROW][C]54[/C][C]7.2[/C][C]7.58462677581325[/C][C]-0.384626775813249[/C][/ROW]
[ROW][C]55[/C][C]7.3[/C][C]7.33743815601533[/C][C]-0.0374381560153299[/C][/ROW]
[ROW][C]56[/C][C]7.4[/C][C]7.47874050689777[/C][C]-0.0787405068977731[/C][/ROW]
[ROW][C]57[/C][C]7.4[/C][C]7.48181859161387[/C][C]-0.0818185916138734[/C][/ROW]
[ROW][C]58[/C][C]7.5[/C][C]7.5111046639032[/C][C]-0.0111046639032017[/C][/ROW]
[ROW][C]59[/C][C]7.4[/C][C]7.71038573612483[/C][C]-0.310385736124833[/C][/ROW]
[ROW][C]60[/C][C]7.4[/C][C]7.66198772304922[/C][C]-0.261987723049216[/C][/ROW]
[/TABLE]
Source: https://freestatistics.org/blog/index.php?pk=200378&T=4

Globally Unique Identifier (entire table): ba.freestatistics.org/blog/index.php?pk=200378&T=4

As an alternative you can also use a QR Code:  

The GUIDs for individual cells are displayed in the table below:

Multiple Linear Regression - Actuals, Interpolation, and Residuals
Time or IndexActualsInterpolationForecastResidualsPrediction Error
17.17.5289540495103-0.428954049510305
27.27.36404410757928-0.16404410757928
37.27.4070685089383-0.2070685089383
47.17.3578341361418-0.257834136141803
56.97.40580348554146-0.505803485541455
66.87.54208454891311-0.74208454891311
76.87.51609643547895-0.716096435478951
86.87.46846435272228-0.668464352722284
96.97.64209601465233-0.74209601465233
107.17.41647305799164-0.316473057991642
117.27.53929242494146-0.339292424941456
127.27.38971623337559-0.189716233375588
137.17.41668505038593-0.316685050385929
147.17.62767388538693-0.527673885386929
157.27.33919793743086-0.139197937430862
167.57.7158139210074-0.215813921007403
177.77.72252103037835-0.0225210303783494
187.87.81865706194785-0.0186570619478455
197.77.8180593549838-0.118059354983802
207.77.97603191429327-0.276031914293265
217.87.90432432169563-0.104324321695626
2287.918979369737480.0810206302625181
238.18.067337952844010.0326620471559932
248.18.001277915884110.0987220841158932
2588.15689906568-0.15689906568
268.17.985902456388350.114097543611646
278.27.896773274943040.303226725056961
288.48.058630517295120.341369482704882
298.57.817088220449380.682911779550617
308.58.102973316042940.397026683957062
318.57.755861128120960.744138871879042
328.57.753801086483440.746198913516557
338.57.650178663889620.849821336110384
348.47.425158578427410.974841421572588
358.37.544765344219440.755234655780559
368.27.252834056205590.947165943794413
378.17.274825245018710.825174754981285
387.97.1590314681750.740968531825003
397.67.015271578527240.584728421472759
407.37.052705525080770.247294474919229
417.16.996964311821550.10303568817845
4277.16120400870534-0.161204008705342
437.17.16242001142004-0.0624200114200389
447.17.34228051253213-0.242280512532129
457.17.1069738147109-0.00697381471090333
467.37.36177032673124-0.0617703267312427
477.37.276235145495830.0237648545041729
487.37.267541632084750.0324583679152456
497.27.33355193086507-0.13355193086507
507.27.40738422339064-0.207384223390638
517.17.38827459766181-0.288274597661808
527.17.14785131147412-0.0478513114741164
537.17.17425942297998-0.0742594229799812
547.27.58462677581325-0.384626775813249
557.37.33743815601533-0.0374381560153299
567.47.47874050689777-0.0787405068977731
577.47.48181859161387-0.0818185916138734
587.57.5111046639032-0.0111046639032017
597.47.71038573612483-0.310385736124833
607.47.66198772304922-0.261987723049216


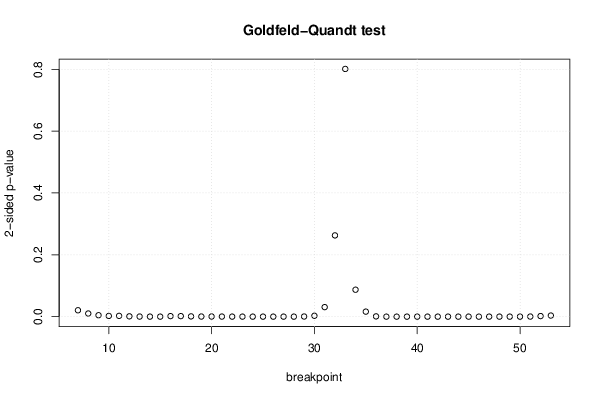
Goldfeld-Quandt test for Heteroskedasticity
p-valuesAlternative Hypothesis
breakpoint indexgreater2-sidedless
70.01034080492301530.02068160984603050.989659195076985
80.00507531967228120.01015063934456240.994924680327719
90.0022943907639480.004588781527895990.997705609236052
100.001172967829522220.002345935659044440.998827032170478
110.001276449903424310.002552899806848620.998723550096576
120.0005063761783324810.001012752356664960.999493623821668
130.0001464870444057940.0002929740888115880.999853512955594
144.87036555059927e-059.74073110119853e-050.999951296344494
151.80441580313357e-053.60883160626713e-050.999981955841969
160.000859429833950570.001718859667901140.999140570166049
170.000847756457605850.00169551291521170.999152243542394
180.0004033104192640590.0008066208385281180.999596689580736
190.0001799584998818550.0003599169997637090.999820041500118
200.0002276144880434230.0004552289760868470.999772385511957
210.0001425584100228620.0002851168200457250.999857441589977
225.49960968488051e-050.000109992193697610.999945003903151
232.08610310782495e-054.17220621564989e-050.999979138968922
247.44910126241524e-061.48982025248305e-050.999992550898738
255.20708878638697e-061.04141775727739e-050.999994792911214
262.00527812605127e-064.01055625210255e-060.999997994721874
278.81831199006623e-071.76366239801325e-060.999999118168801
287.21898211738376e-061.44379642347675e-050.999992781017883
290.0002220736971888940.0004441473943777890.999777926302811
300.00143977568756750.002879551375135010.998560224312433
310.01541635337664250.03083270675328490.984583646623358
320.1314132654743840.2628265309487680.868586734525616
330.5993726750545740.8012546498908510.400627324945426
340.9564429189887670.08711416202246510.0435570810112325
350.9918968525874130.01620629482517380.0081031474125869
360.9995394939872230.0009210120255542780.000460506012777139
370.9999953115318589.37693628300463e-064.68846814150232e-06
380.9999999871451432.57097144521289e-081.28548572260645e-08
390.9999999988544382.29112448462704e-091.14556224231352e-09
400.9999999994862851.02743016410199e-095.13715082050993e-10
410.9999999978221084.35578438916075e-092.17789219458037e-09
420.9999999875872862.48254269800717e-081.24127134900359e-08
430.99999993256181.34876399709746e-076.74381998548729e-08
440.9999996721239626.55752076393651e-073.27876038196825e-07
450.9999982966471793.40670564149155e-061.70335282074577e-06
460.9999924878245381.50243509234769e-057.51217546173846e-06
470.9999838258739923.2348252016592e-051.6174126008296e-05
480.99999263746991.47250602001017e-057.36253010005086e-06
490.9999876927315292.46145369412644e-051.23072684706322e-05
500.9999826681347663.46637304673616e-051.73318652336808e-05
510.9998639384821190.0002721230357628710.000136061517881436
520.9990688404254920.001862319149014920.000931159574507458
530.9982137233021940.00357255339561210.00178627669780605

\begin{tabular}{lllllllll}
\hline
Goldfeld-Quandt test for Heteroskedasticity \tabularnewline
p-values & Alternative Hypothesis \tabularnewline
breakpoint index & greater & 2-sided & less \tabularnewline
7 & 0.0103408049230153 & 0.0206816098460305 & 0.989659195076985 \tabularnewline
8 & 0.0050753196722812 & 0.0101506393445624 & 0.994924680327719 \tabularnewline
9 & 0.002294390763948 & 0.00458878152789599 & 0.997705609236052 \tabularnewline
10 & 0.00117296782952222 & 0.00234593565904444 & 0.998827032170478 \tabularnewline
11 & 0.00127644990342431 & 0.00255289980684862 & 0.998723550096576 \tabularnewline
12 & 0.000506376178332481 & 0.00101275235666496 & 0.999493623821668 \tabularnewline
13 & 0.000146487044405794 & 0.000292974088811588 & 0.999853512955594 \tabularnewline
14 & 4.87036555059927e-05 & 9.74073110119853e-05 & 0.999951296344494 \tabularnewline
15 & 1.80441580313357e-05 & 3.60883160626713e-05 & 0.999981955841969 \tabularnewline
16 & 0.00085942983395057 & 0.00171885966790114 & 0.999140570166049 \tabularnewline
17 & 0.00084775645760585 & 0.0016955129152117 & 0.999152243542394 \tabularnewline
18 & 0.000403310419264059 & 0.000806620838528118 & 0.999596689580736 \tabularnewline
19 & 0.000179958499881855 & 0.000359916999763709 & 0.999820041500118 \tabularnewline
20 & 0.000227614488043423 & 0.000455228976086847 & 0.999772385511957 \tabularnewline
21 & 0.000142558410022862 & 0.000285116820045725 & 0.999857441589977 \tabularnewline
22 & 5.49960968488051e-05 & 0.00010999219369761 & 0.999945003903151 \tabularnewline
23 & 2.08610310782495e-05 & 4.17220621564989e-05 & 0.999979138968922 \tabularnewline
24 & 7.44910126241524e-06 & 1.48982025248305e-05 & 0.999992550898738 \tabularnewline
25 & 5.20708878638697e-06 & 1.04141775727739e-05 & 0.999994792911214 \tabularnewline
26 & 2.00527812605127e-06 & 4.01055625210255e-06 & 0.999997994721874 \tabularnewline
27 & 8.81831199006623e-07 & 1.76366239801325e-06 & 0.999999118168801 \tabularnewline
28 & 7.21898211738376e-06 & 1.44379642347675e-05 & 0.999992781017883 \tabularnewline
29 & 0.000222073697188894 & 0.000444147394377789 & 0.999777926302811 \tabularnewline
30 & 0.0014397756875675 & 0.00287955137513501 & 0.998560224312433 \tabularnewline
31 & 0.0154163533766425 & 0.0308327067532849 & 0.984583646623358 \tabularnewline
32 & 0.131413265474384 & 0.262826530948768 & 0.868586734525616 \tabularnewline
33 & 0.599372675054574 & 0.801254649890851 & 0.400627324945426 \tabularnewline
34 & 0.956442918988767 & 0.0871141620224651 & 0.0435570810112325 \tabularnewline
35 & 0.991896852587413 & 0.0162062948251738 & 0.0081031474125869 \tabularnewline
36 & 0.999539493987223 & 0.000921012025554278 & 0.000460506012777139 \tabularnewline
37 & 0.999995311531858 & 9.37693628300463e-06 & 4.68846814150232e-06 \tabularnewline
38 & 0.999999987145143 & 2.57097144521289e-08 & 1.28548572260645e-08 \tabularnewline
39 & 0.999999998854438 & 2.29112448462704e-09 & 1.14556224231352e-09 \tabularnewline
40 & 0.999999999486285 & 1.02743016410199e-09 & 5.13715082050993e-10 \tabularnewline
41 & 0.999999997822108 & 4.35578438916075e-09 & 2.17789219458037e-09 \tabularnewline
42 & 0.999999987587286 & 2.48254269800717e-08 & 1.24127134900359e-08 \tabularnewline
43 & 0.9999999325618 & 1.34876399709746e-07 & 6.74381998548729e-08 \tabularnewline
44 & 0.999999672123962 & 6.55752076393651e-07 & 3.27876038196825e-07 \tabularnewline
45 & 0.999998296647179 & 3.40670564149155e-06 & 1.70335282074577e-06 \tabularnewline
46 & 0.999992487824538 & 1.50243509234769e-05 & 7.51217546173846e-06 \tabularnewline
47 & 0.999983825873992 & 3.2348252016592e-05 & 1.6174126008296e-05 \tabularnewline
48 & 0.9999926374699 & 1.47250602001017e-05 & 7.36253010005086e-06 \tabularnewline
49 & 0.999987692731529 & 2.46145369412644e-05 & 1.23072684706322e-05 \tabularnewline
50 & 0.999982668134766 & 3.46637304673616e-05 & 1.73318652336808e-05 \tabularnewline
51 & 0.999863938482119 & 0.000272123035762871 & 0.000136061517881436 \tabularnewline
52 & 0.999068840425492 & 0.00186231914901492 & 0.000931159574507458 \tabularnewline
53 & 0.998213723302194 & 0.0035725533956121 & 0.00178627669780605 \tabularnewline
\hline
\end{tabular}
%Source: https://freestatistics.org/blog/index.php?pk=200378&T=5

[TABLE]
[ROW][C]Goldfeld-Quandt test for Heteroskedasticity[/C][/ROW]
[ROW][C]p-values[/C][C]Alternative Hypothesis[/C][/ROW]
[ROW][C]breakpoint index[/C][C]greater[/C][C]2-sided[/C][C]less[/C][/ROW]
[ROW][C]7[/C][C]0.0103408049230153[/C][C]0.0206816098460305[/C][C]0.989659195076985[/C][/ROW]
[ROW][C]8[/C][C]0.0050753196722812[/C][C]0.0101506393445624[/C][C]0.994924680327719[/C][/ROW]
[ROW][C]9[/C][C]0.002294390763948[/C][C]0.00458878152789599[/C][C]0.997705609236052[/C][/ROW]
[ROW][C]10[/C][C]0.00117296782952222[/C][C]0.00234593565904444[/C][C]0.998827032170478[/C][/ROW]
[ROW][C]11[/C][C]0.00127644990342431[/C][C]0.00255289980684862[/C][C]0.998723550096576[/C][/ROW]
[ROW][C]12[/C][C]0.000506376178332481[/C][C]0.00101275235666496[/C][C]0.999493623821668[/C][/ROW]
[ROW][C]13[/C][C]0.000146487044405794[/C][C]0.000292974088811588[/C][C]0.999853512955594[/C][/ROW]
[ROW][C]14[/C][C]4.87036555059927e-05[/C][C]9.74073110119853e-05[/C][C]0.999951296344494[/C][/ROW]
[ROW][C]15[/C][C]1.80441580313357e-05[/C][C]3.60883160626713e-05[/C][C]0.999981955841969[/C][/ROW]
[ROW][C]16[/C][C]0.00085942983395057[/C][C]0.00171885966790114[/C][C]0.999140570166049[/C][/ROW]
[ROW][C]17[/C][C]0.00084775645760585[/C][C]0.0016955129152117[/C][C]0.999152243542394[/C][/ROW]
[ROW][C]18[/C][C]0.000403310419264059[/C][C]0.000806620838528118[/C][C]0.999596689580736[/C][/ROW]
[ROW][C]19[/C][C]0.000179958499881855[/C][C]0.000359916999763709[/C][C]0.999820041500118[/C][/ROW]
[ROW][C]20[/C][C]0.000227614488043423[/C][C]0.000455228976086847[/C][C]0.999772385511957[/C][/ROW]
[ROW][C]21[/C][C]0.000142558410022862[/C][C]0.000285116820045725[/C][C]0.999857441589977[/C][/ROW]
[ROW][C]22[/C][C]5.49960968488051e-05[/C][C]0.00010999219369761[/C][C]0.999945003903151[/C][/ROW]
[ROW][C]23[/C][C]2.08610310782495e-05[/C][C]4.17220621564989e-05[/C][C]0.999979138968922[/C][/ROW]
[ROW][C]24[/C][C]7.44910126241524e-06[/C][C]1.48982025248305e-05[/C][C]0.999992550898738[/C][/ROW]
[ROW][C]25[/C][C]5.20708878638697e-06[/C][C]1.04141775727739e-05[/C][C]0.999994792911214[/C][/ROW]
[ROW][C]26[/C][C]2.00527812605127e-06[/C][C]4.01055625210255e-06[/C][C]0.999997994721874[/C][/ROW]
[ROW][C]27[/C][C]8.81831199006623e-07[/C][C]1.76366239801325e-06[/C][C]0.999999118168801[/C][/ROW]
[ROW][C]28[/C][C]7.21898211738376e-06[/C][C]1.44379642347675e-05[/C][C]0.999992781017883[/C][/ROW]
[ROW][C]29[/C][C]0.000222073697188894[/C][C]0.000444147394377789[/C][C]0.999777926302811[/C][/ROW]
[ROW][C]30[/C][C]0.0014397756875675[/C][C]0.00287955137513501[/C][C]0.998560224312433[/C][/ROW]
[ROW][C]31[/C][C]0.0154163533766425[/C][C]0.0308327067532849[/C][C]0.984583646623358[/C][/ROW]
[ROW][C]32[/C][C]0.131413265474384[/C][C]0.262826530948768[/C][C]0.868586734525616[/C][/ROW]
[ROW][C]33[/C][C]0.599372675054574[/C][C]0.801254649890851[/C][C]0.400627324945426[/C][/ROW]
[ROW][C]34[/C][C]0.956442918988767[/C][C]0.0871141620224651[/C][C]0.0435570810112325[/C][/ROW]
[ROW][C]35[/C][C]0.991896852587413[/C][C]0.0162062948251738[/C][C]0.0081031474125869[/C][/ROW]
[ROW][C]36[/C][C]0.999539493987223[/C][C]0.000921012025554278[/C][C]0.000460506012777139[/C][/ROW]
[ROW][C]37[/C][C]0.999995311531858[/C][C]9.37693628300463e-06[/C][C]4.68846814150232e-06[/C][/ROW]
[ROW][C]38[/C][C]0.999999987145143[/C][C]2.57097144521289e-08[/C][C]1.28548572260645e-08[/C][/ROW]
[ROW][C]39[/C][C]0.999999998854438[/C][C]2.29112448462704e-09[/C][C]1.14556224231352e-09[/C][/ROW]
[ROW][C]40[/C][C]0.999999999486285[/C][C]1.02743016410199e-09[/C][C]5.13715082050993e-10[/C][/ROW]
[ROW][C]41[/C][C]0.999999997822108[/C][C]4.35578438916075e-09[/C][C]2.17789219458037e-09[/C][/ROW]
[ROW][C]42[/C][C]0.999999987587286[/C][C]2.48254269800717e-08[/C][C]1.24127134900359e-08[/C][/ROW]
[ROW][C]43[/C][C]0.9999999325618[/C][C]1.34876399709746e-07[/C][C]6.74381998548729e-08[/C][/ROW]
[ROW][C]44[/C][C]0.999999672123962[/C][C]6.55752076393651e-07[/C][C]3.27876038196825e-07[/C][/ROW]
[ROW][C]45[/C][C]0.999998296647179[/C][C]3.40670564149155e-06[/C][C]1.70335282074577e-06[/C][/ROW]
[ROW][C]46[/C][C]0.999992487824538[/C][C]1.50243509234769e-05[/C][C]7.51217546173846e-06[/C][/ROW]
[ROW][C]47[/C][C]0.999983825873992[/C][C]3.2348252016592e-05[/C][C]1.6174126008296e-05[/C][/ROW]
[ROW][C]48[/C][C]0.9999926374699[/C][C]1.47250602001017e-05[/C][C]7.36253010005086e-06[/C][/ROW]
[ROW][C]49[/C][C]0.999987692731529[/C][C]2.46145369412644e-05[/C][C]1.23072684706322e-05[/C][/ROW]
[ROW][C]50[/C][C]0.999982668134766[/C][C]3.46637304673616e-05[/C][C]1.73318652336808e-05[/C][/ROW]
[ROW][C]51[/C][C]0.999863938482119[/C][C]0.000272123035762871[/C][C]0.000136061517881436[/C][/ROW]
[ROW][C]52[/C][C]0.999068840425492[/C][C]0.00186231914901492[/C][C]0.000931159574507458[/C][/ROW]
[ROW][C]53[/C][C]0.998213723302194[/C][C]0.0035725533956121[/C][C]0.00178627669780605[/C][/ROW]
[/TABLE]
Source: https://freestatistics.org/blog/index.php?pk=200378&T=5

Globally Unique Identifier (entire table): ba.freestatistics.org/blog/index.php?pk=200378&T=5

As an alternative you can also use a QR Code:  

The GUIDs for individual cells are displayed in the table below:

Goldfeld-Quandt test for Heteroskedasticity
p-valuesAlternative Hypothesis
breakpoint indexgreater2-sidedless
70.01034080492301530.02068160984603050.989659195076985
80.00507531967228120.01015063934456240.994924680327719
90.0022943907639480.004588781527895990.997705609236052
100.001172967829522220.002345935659044440.998827032170478
110.001276449903424310.002552899806848620.998723550096576
120.0005063761783324810.001012752356664960.999493623821668
130.0001464870444057940.0002929740888115880.999853512955594
144.87036555059927e-059.74073110119853e-050.999951296344494
151.80441580313357e-053.60883160626713e-050.999981955841969
160.000859429833950570.001718859667901140.999140570166049
170.000847756457605850.00169551291521170.999152243542394
180.0004033104192640590.0008066208385281180.999596689580736
190.0001799584998818550.0003599169997637090.999820041500118
200.0002276144880434230.0004552289760868470.999772385511957
210.0001425584100228620.0002851168200457250.999857441589977
225.49960968488051e-050.000109992193697610.999945003903151
232.08610310782495e-054.17220621564989e-050.999979138968922
247.44910126241524e-061.48982025248305e-050.999992550898738
255.20708878638697e-061.04141775727739e-050.999994792911214
262.00527812605127e-064.01055625210255e-060.999997994721874
278.81831199006623e-071.76366239801325e-060.999999118168801
287.21898211738376e-061.44379642347675e-050.999992781017883
290.0002220736971888940.0004441473943777890.999777926302811
300.00143977568756750.002879551375135010.998560224312433
310.01541635337664250.03083270675328490.984583646623358
320.1314132654743840.2628265309487680.868586734525616
330.5993726750545740.8012546498908510.400627324945426
340.9564429189887670.08711416202246510.0435570810112325
350.9918968525874130.01620629482517380.0081031474125869
360.9995394939872230.0009210120255542780.000460506012777139
370.9999953115318589.37693628300463e-064.68846814150232e-06
380.9999999871451432.57097144521289e-081.28548572260645e-08
390.9999999988544382.29112448462704e-091.14556224231352e-09
400.9999999994862851.02743016410199e-095.13715082050993e-10
410.9999999978221084.35578438916075e-092.17789219458037e-09
420.9999999875872862.48254269800717e-081.24127134900359e-08
430.99999993256181.34876399709746e-076.74381998548729e-08
440.9999996721239626.55752076393651e-073.27876038196825e-07
450.9999982966471793.40670564149155e-061.70335282074577e-06
460.9999924878245381.50243509234769e-057.51217546173846e-06
470.9999838258739923.2348252016592e-051.6174126008296e-05
480.99999263746991.47250602001017e-057.36253010005086e-06
490.9999876927315292.46145369412644e-051.23072684706322e-05
500.9999826681347663.46637304673616e-051.73318652336808e-05
510.9998639384821190.0002721230357628710.000136061517881436
520.9990688404254920.001862319149014920.000931159574507458
530.9982137233021940.00357255339561210.00178627669780605


Meta Analysis of Goldfeld-Quandt test for Heteroskedasticity
Description# significant tests% significant testsOK/NOK
1% type I error level400.851063829787234NOK
5% type I error level440.936170212765957NOK
10% type I error level450.957446808510638NOK

\begin{tabular}{lllllllll}
\hline
Meta Analysis of Goldfeld-Quandt test for Heteroskedasticity \tabularnewline
Description & # significant tests & % significant tests & OK/NOK \tabularnewline
1% type I error level & 40 & 0.851063829787234 & NOK \tabularnewline
5% type I error level & 44 & 0.936170212765957 & NOK \tabularnewline
10% type I error level & 45 & 0.957446808510638 & NOK \tabularnewline
\hline
\end{tabular}
%Source: https://freestatistics.org/blog/index.php?pk=200378&T=6

[TABLE]
[ROW][C]Meta Analysis of Goldfeld-Quandt test for Heteroskedasticity[/C][/ROW]
[ROW][C]Description[/C][C]# significant tests[/C][C]% significant tests[/C][C]OK/NOK[/C][/ROW]
[ROW][C]1% type I error level[/C][C]40[/C][C]0.851063829787234[/C][C]NOK[/C][/ROW]
[ROW][C]5% type I error level[/C][C]44[/C][C]0.936170212765957[/C][C]NOK[/C][/ROW]
[ROW][C]10% type I error level[/C][C]45[/C][C]0.957446808510638[/C][C]NOK[/C][/ROW]
[/TABLE]
Source: https://freestatistics.org/blog/index.php?pk=200378&T=6

Globally Unique Identifier (entire table): ba.freestatistics.org/blog/index.php?pk=200378&T=6

As an alternative you can also use a QR Code:  

The GUIDs for individual cells are displayed in the table below:

Meta Analysis of Goldfeld-Quandt test for Heteroskedasticity
Description# significant tests% significant testsOK/NOK
1% type I error level400.851063829787234NOK
5% type I error level440.936170212765957NOK
10% type I error level450.957446808510638NOK


Parameters (Session):
par1 = 1 ; par2 = Do not include Seasonal Dummies ; par3 = No Linear Trend ;
Parameters (R input):
par1 = 1 ; par2 = Do not include Seasonal Dummies ; par3 = No Linear Trend ;
R code (references can be found in the software module):
library(lattice)
library(lmtest)
n25 <- 25 #minimum number of obs. for Goldfeld-Quandt test
par1 <- as.numeric(par1)
x <- t(y)
k <- length(x[1,])
n <- length(x[,1])
x1 <- cbind(x[,par1], x[,1:k!=par1])
mycolnames <- c(colnames(x)[par1], colnames(x)[1:k!=par1])
colnames(x1) <- mycolnames #colnames(x)[par1]
x <- x1
if (par3 == 'First Differences'){
x2 <- array(0, dim=c(n-1,k), dimnames=list(1:(n-1), paste('(1-B)',colnames(x),sep='')))
for (i in 1:n-1) {
for (j in 1:k) {
x2[i,j] <- x[i+1,j] - x[i,j]
}
}
x <- x2
}
if (par2 == 'Include Monthly Dummies'){
x2 <- array(0, dim=c(n,11), dimnames=list(1:n, paste('M', seq(1:11), sep ='')))
for (i in 1:11){
x2[seq(i,n,12),i] <- 1
}
x <- cbind(x, x2)
}
if (par2 == 'Include Quarterly Dummies'){
x2 <- array(0, dim=c(n,3), dimnames=list(1:n, paste('Q', seq(1:3), sep ='')))
for (i in 1:3){
x2[seq(i,n,4),i] <- 1
}
x <- cbind(x, x2)
}
k <- length(x[1,])
if (par3 == 'Linear Trend'){
x <- cbind(x, c(1:n))
colnames(x)[k+1] <- 't'
}
x
k <- length(x[1,])
df <- as.data.frame(x)
(mylm <- lm(df))
(mysum <- summary(mylm))
if (n > n25) {
kp3 <- k + 3
nmkm3 <- n - k - 3
gqarr <- array(NA, dim=c(nmkm3-kp3+1,3))
numgqtests <- 0
numsignificant1 <- 0
numsignificant5 <- 0
numsignificant10 <- 0
for (mypoint in kp3:nmkm3) {
j <- 0
numgqtests <- numgqtests + 1
for (myalt in c('greater', 'two.sided', 'less')) {
j <- j + 1
gqarr[mypoint-kp3+1,j] <- gqtest(mylm, point=mypoint, alternative=myalt)$p.value
}
if (gqarr[mypoint-kp3+1,2] < 0.01) numsignificant1 <- numsignificant1 + 1
if (gqarr[mypoint-kp3+1,2] < 0.05) numsignificant5 <- numsignificant5 + 1
if (gqarr[mypoint-kp3+1,2] < 0.10) numsignificant10 <- numsignificant10 + 1
}
gqarr
}
bitmap(file='test0.png')
plot(x[,1], type='l', main='Actuals and Interpolation', ylab='value of Actuals and Interpolation (dots)', xlab='time or index')
points(x[,1]-mysum$resid)
grid()
dev.off()
bitmap(file='test1.png')
plot(mysum$resid, type='b', pch=19, main='Residuals', ylab='value of Residuals', xlab='time or index')
grid()
dev.off()
bitmap(file='test2.png')
hist(mysum$resid, main='Residual Histogram', xlab='values of Residuals')
grid()
dev.off()
bitmap(file='test3.png')
densityplot(~mysum$resid,col='black',main='Residual Density Plot', xlab='values of Residuals')
dev.off()
bitmap(file='test4.png')
qqnorm(mysum$resid, main='Residual Normal Q-Q Plot')
qqline(mysum$resid)
grid()
dev.off()
(myerror <- as.ts(mysum$resid))
bitmap(file='test5.png')
dum <- cbind(lag(myerror,k=1),myerror)
dum
dum1 <- dum[2:length(myerror),]
dum1
z <- as.data.frame(dum1)
z
plot(z,main=paste('Residual Lag plot, lowess, and regression line'), ylab='values of Residuals', xlab='lagged values of Residuals')
lines(lowess(z))
abline(lm(z))
grid()
dev.off()
bitmap(file='test6.png')
acf(mysum$resid, lag.max=length(mysum$resid)/2, main='Residual Autocorrelation Function')
grid()
dev.off()
bitmap(file='test7.png')
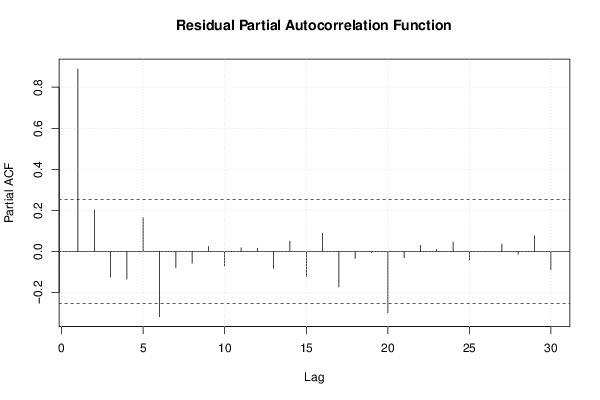
pacf(mysum$resid, lag.max=length(mysum$resid)/2, main='Residual Partial Autocorrelation Function')
grid()
dev.off()
bitmap(file='test8.png')
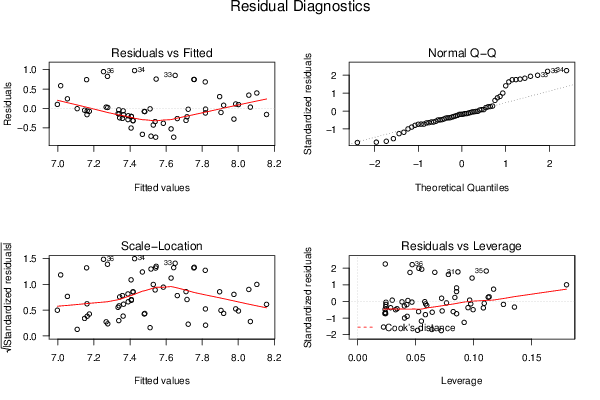
opar <- par(mfrow = c(2,2), oma = c(0, 0, 1.1, 0))
plot(mylm, las = 1, sub='Residual Diagnostics')
par(opar)
dev.off()
if (n > n25) {
bitmap(file='test9.png')
plot(kp3:nmkm3,gqarr[,2], main='Goldfeld-Quandt test',ylab='2-sided p-value',xlab='breakpoint')
grid()
dev.off()
}
load(file='createtable')
a<-table.start()
a<-table.row.start(a)
a<-table.element(a, 'Multiple Linear Regression - Estimated Regression Equation', 1, TRUE)
a<-table.row.end(a)
myeq <- colnames(x)[1]
myeq <- paste(myeq, '[t] = ', sep='')
for (i in 1:k){
if (mysum$coefficients[i,1] > 0) myeq <- paste(myeq, '+', '')
myeq <- paste(myeq, mysum$coefficients[i,1], sep=' ')
if (rownames(mysum$coefficients)[i] != '(Intercept)') {
myeq <- paste(myeq, rownames(mysum$coefficients)[i], sep='')
if (rownames(mysum$coefficients)[i] != 't') myeq <- paste(myeq, '[t]', sep='')
}
}
myeq <- paste(myeq, ' + e[t]')
a<-table.row.start(a)
a<-table.element(a, myeq)
a<-table.row.end(a)
a<-table.end(a)
table.save(a,file='mytable1.tab')
a<-table.start()
a<-table.row.start(a)
a<-table.element(a,hyperlink('ols1.htm','Multiple Linear Regression - Ordinary Least Squares',''), 6, TRUE)
a<-table.row.end(a)
a<-table.row.start(a)
a<-table.element(a,'Variable',header=TRUE)
a<-table.element(a,'Parameter',header=TRUE)
a<-table.element(a,'S.D.',header=TRUE)
a<-table.element(a,'T-STAT
H0: parameter = 0',header=TRUE)
a<-table.element(a,'2-tail p-value',header=TRUE)
a<-table.element(a,'1-tail p-value',header=TRUE)
a<-table.row.end(a)
for (i in 1:k){
a<-table.row.start(a)
a<-table.element(a,rownames(mysum$coefficients)[i],header=TRUE)
a<-table.element(a,mysum$coefficients[i,1])
a<-table.element(a, round(mysum$coefficients[i,2],6))
a<-table.element(a, round(mysum$coefficients[i,3],4))
a<-table.element(a, round(mysum$coefficients[i,4],6))
a<-table.element(a, round(mysum$coefficients[i,4]/2,6))
a<-table.row.end(a)
}
a<-table.end(a)
table.save(a,file='mytable2.tab')
a<-table.start()
a<-table.row.start(a)
a<-table.element(a, 'Multiple Linear Regression - Regression Statistics', 2, TRUE)
a<-table.row.end(a)
a<-table.row.start(a)
a<-table.element(a, 'Multiple R',1,TRUE)
a<-table.element(a, sqrt(mysum$r.squared))
a<-table.row.end(a)
a<-table.row.start(a)
a<-table.element(a, 'R-squared',1,TRUE)
a<-table.element(a, mysum$r.squared)
a<-table.row.end(a)
a<-table.row.start(a)
a<-table.element(a, 'Adjusted R-squared',1,TRUE)
a<-table.element(a, mysum$adj.r.squared)
a<-table.row.end(a)
a<-table.row.start(a)
a<-table.element(a, 'F-TEST (value)',1,TRUE)
a<-table.element(a, mysum$fstatistic[1])
a<-table.row.end(a)
a<-table.row.start(a)
a<-table.element(a, 'F-TEST (DF numerator)',1,TRUE)
a<-table.element(a, mysum$fstatistic[2])
a<-table.row.end(a)
a<-table.row.start(a)
a<-table.element(a, 'F-TEST (DF denominator)',1,TRUE)
a<-table.element(a, mysum$fstatistic[3])
a<-table.row.end(a)
a<-table.row.start(a)
a<-table.element(a, 'p-value',1,TRUE)
a<-table.element(a, 1-pf(mysum$fstatistic[1],mysum$fstatistic[2],mysum$fstatistic[3]))
a<-table.row.end(a)
a<-table.row.start(a)
a<-table.element(a, 'Multiple Linear Regression - Residual Statistics', 2, TRUE)
a<-table.row.end(a)
a<-table.row.start(a)
a<-table.element(a, 'Residual Standard Deviation',1,TRUE)
a<-table.element(a, mysum$sigma)
a<-table.row.end(a)
a<-table.row.start(a)
a<-table.element(a, 'Sum Squared Residuals',1,TRUE)
a<-table.element(a, sum(myerror*myerror))
a<-table.row.end(a)
a<-table.end(a)
table.save(a,file='mytable3.tab')
a<-table.start()
a<-table.row.start(a)
a<-table.element(a, 'Multiple Linear Regression - Actuals, Interpolation, and Residuals', 4, TRUE)
a<-table.row.end(a)
a<-table.row.start(a)
a<-table.element(a, 'Time or Index', 1, TRUE)
a<-table.element(a, 'Actuals', 1, TRUE)
a<-table.element(a, 'Interpolation
Forecast', 1, TRUE)
a<-table.element(a, 'Residuals
Prediction Error', 1, TRUE)
a<-table.row.end(a)
for (i in 1:n) {
a<-table.row.start(a)
a<-table.element(a,i, 1, TRUE)
a<-table.element(a,x[i])
a<-table.element(a,x[i]-mysum$resid[i])
a<-table.element(a,mysum$resid[i])
a<-table.row.end(a)
}
a<-table.end(a)
table.save(a,file='mytable4.tab')
if (n > n25) {
a<-table.start()
a<-table.row.start(a)
a<-table.element(a,'Goldfeld-Quandt test for Heteroskedasticity',4,TRUE)
a<-table.row.end(a)
a<-table.row.start(a)
a<-table.element(a,'p-values',header=TRUE)
a<-table.element(a,'Alternative Hypothesis',3,header=TRUE)
a<-table.row.end(a)
a<-table.row.start(a)
a<-table.element(a,'breakpoint index',header=TRUE)
a<-table.element(a,'greater',header=TRUE)
a<-table.element(a,'2-sided',header=TRUE)
a<-table.element(a,'less',header=TRUE)
a<-table.row.end(a)
for (mypoint in kp3:nmkm3) {
a<-table.row.start(a)
a<-table.element(a,mypoint,header=TRUE)
a<-table.element(a,gqarr[mypoint-kp3+1,1])
a<-table.element(a,gqarr[mypoint-kp3+1,2])
a<-table.element(a,gqarr[mypoint-kp3+1,3])
a<-table.row.end(a)
}
a<-table.end(a)
table.save(a,file='mytable5.tab')
a<-table.start()
a<-table.row.start(a)
a<-table.element(a,'Meta Analysis of Goldfeld-Quandt test for Heteroskedasticity',4,TRUE)
a<-table.row.end(a)
a<-table.row.start(a)
a<-table.element(a,'Description',header=TRUE)
a<-table.element(a,'# significant tests',header=TRUE)
a<-table.element(a,'% significant tests',header=TRUE)
a<-table.element(a,'OK/NOK',header=TRUE)
a<-table.row.end(a)
a<-table.row.start(a)
a<-table.element(a,'1% type I error level',header=TRUE)
a<-table.element(a,numsignificant1)
a<-table.element(a,numsignificant1/numgqtests)
if (numsignificant1/numgqtests < 0.01) dum <- 'OK' else dum <- 'NOK'
a<-table.element(a,dum)
a<-table.row.end(a)
a<-table.row.start(a)
a<-table.element(a,'5% type I error level',header=TRUE)
a<-table.element(a,numsignificant5)
a<-table.element(a,numsignificant5/numgqtests)
if (numsignificant5/numgqtests < 0.05) dum <- 'OK' else dum <- 'NOK'
a<-table.element(a,dum)
a<-table.row.end(a)
a<-table.row.start(a)
a<-table.element(a,'10% type I error level',header=TRUE)
a<-table.element(a,numsignificant10)
a<-table.element(a,numsignificant10/numgqtests)
if (numsignificant10/numgqtests < 0.1) dum <- 'OK' else dum <- 'NOK'
a<-table.element(a,dum)
a<-table.row.end(a)
a<-table.end(a)
table.save(a,file='mytable6.tab')
}