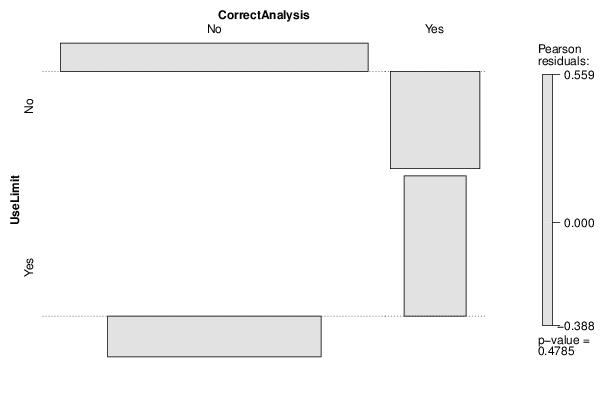
| Tabulation of Results | ||
| UseLimit x CorrectAnalysis | ||
| No | Yes | No | 97 | 7 | Yes | 45 | 5 |
| Tabulation of Expected Results | ||
| UseLimit x CorrectAnalysis | ||
| No | Yes | No | 95.9 | 8.1 | Yes | 46.1 | 3.9 |
| Statistical Results | |
| Pearson's Chi-squared test with Yates' continuity correction | |
| Pearson Chi Square Statistic | 0.15 |
| Degrees of Freedom | 1 |
| P value | 0.7 |