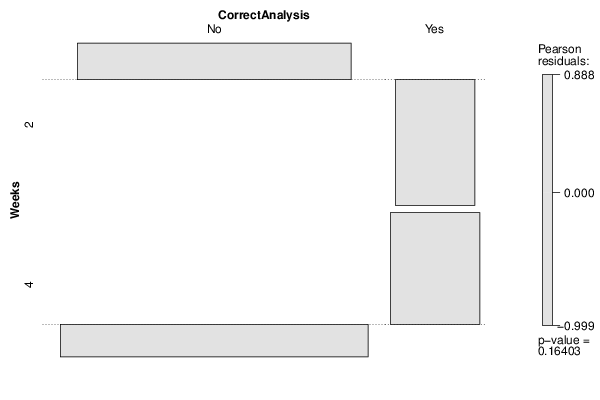
| Tabulation of Results | ||
| Weeks x CorrectAnalysis | ||
| No | Yes | 2 | 65 | 3 | 4 | 77 | 9 |
| Tabulation of Expected Results | ||
| Weeks x CorrectAnalysis | ||
| No | Yes | 2 | 62.7 | 5.3 | 4 | 79.3 | 6.7 |
| Statistical Results | |
| Pearson's Chi-squared test with Yates' continuity correction | |
| Pearson Chi Square Statistic | 1.19 |
| Degrees of Freedom | 1 |
| P value | 0.28 |