| Tabulation of Results | ||
| T40 x Outcome | ||
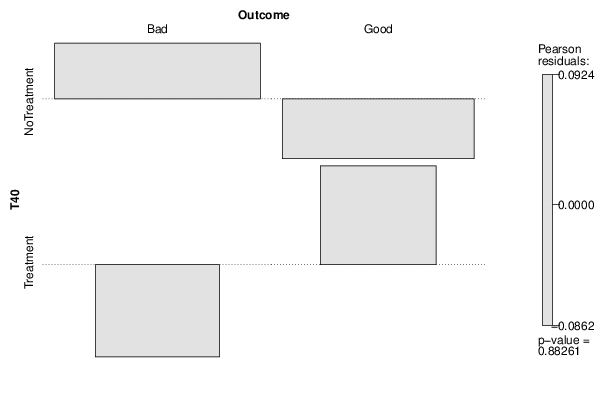
| Bad | Good | NoTreatment | 34 | 29 | Treatment | 12 | 11 |
| Tabulation of Expected Results | ||
| T40 x Outcome | ||
| Bad | Good | NoTreatment | 33.7 | 29.3 | Treatment | 12.3 | 10.7 |
| Statistical Results | |
| Pearson's Chi-squared test with simulated p-value (based on 2000 replicates) | |
| Exact Pearson Chi Square Statistic | 0.02 |
| P value | 1 |