| Tabulation of Results | ||
| Useful x Outcome | ||
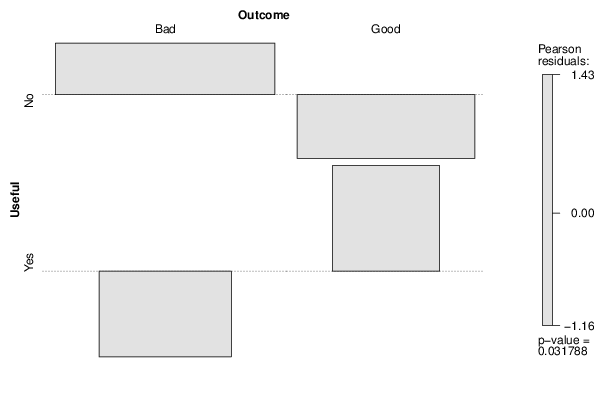
| Bad | Good | No | 74 | 39 | Yes | 19 | 22 |
| Tabulation of Expected Results | ||
| Useful x Outcome | ||
| Bad | Good | No | 68.24 | 44.76 | Yes | 24.76 | 16.24 |
| Statistical Results | |
| Pearson's Chi-squared test with Yates' continuity correction | |
| Pearson Chi Square Statistic | 3.84 |
| Degrees of Freedom | 1 |
| P value | 0.05 |