| Multiple Linear Regression - Estimated Regression Equation |
| RUN[t] = + 45.136512850162 -1.61042016498947SPEED1[t] -0.468106132737128TOTAL[t] -3.12177834831424SPEED2[t] -0.872499786308419NUMBER2[t] -0.844953325355799SENS[t] + 0.0495519672711723TIME[t] + 0.0956233074188925T20BOLT[t] + e[t] |
| Multiple Linear Regression - Ordinary Least Squares | |||||
| Variable | Parameter | S.D. | T-STAT H0: parameter = 0 | 2-tail p-value | 1-tail p-value |
| (Intercept) | 45.136512850162 | 16.173554 | 2.7908 | 0.008791 | 0.004396 |
| SPEED1 | -1.61042016498947 | 1.534615 | -1.0494 | 0.301857 | 0.150928 |
| TOTAL | -0.468106132737128 | 0.394753 | -1.1858 | 0.244424 | 0.122212 |
| SPEED2 | -3.12177834831424 | 4.211655 | -0.7412 | 0.463963 | 0.231982 |
| NUMBER2 | -0.872499786308419 | 2.165438 | -0.4029 | 0.689686 | 0.344843 |
| SENS | -0.844953325355799 | 1.053468 | -0.8021 | 0.42843 | 0.214215 |
| TIME | 0.0495519672711723 | 0.170535 | 0.2906 | 0.773257 | 0.386629 |
| T20BOLT | 0.0956233074188925 | 0.214047 | 0.4467 | 0.658072 | 0.329036 |
| Multiple Linear Regression - Regression Statistics | |
| Multiple R | 0.387503800557626 |
| R-squared | 0.150159195446605 |
| Adjusted R-squared | -0.0357434805494505 |
| F-TEST (value) | 0.807730145045309 |
| F-TEST (DF numerator) | 7 |
| F-TEST (DF denominator) | 32 |
| p-value | 0.587271581998802 |
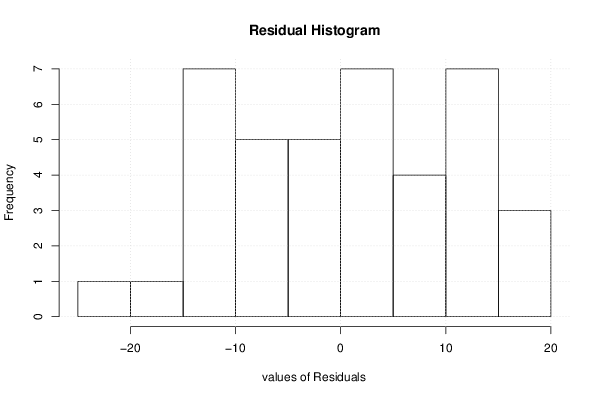
| Multiple Linear Regression - Residual Statistics | |
| Residual Standard Deviation | 11.8975463440335 |
| Sum Squared Residuals | 4529.6514882696 |
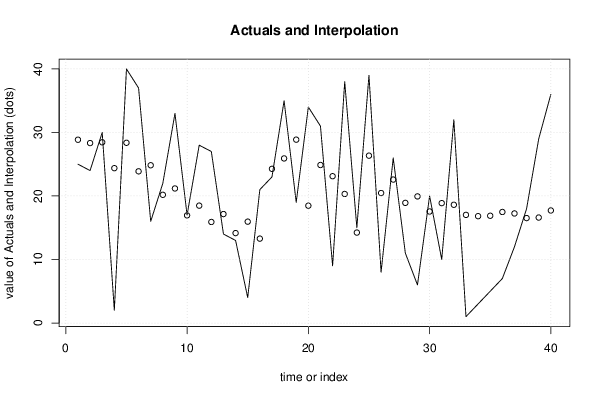
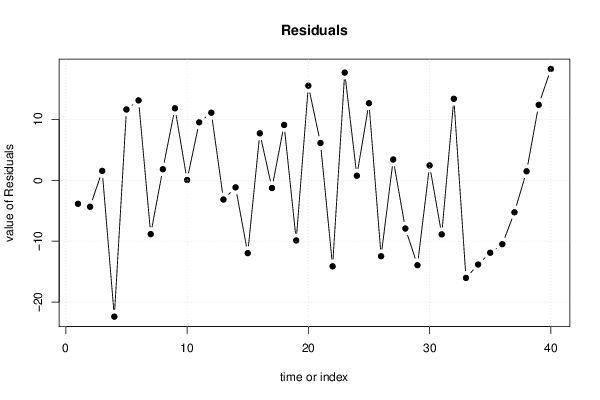
| Multiple Linear Regression - Actuals, Interpolation, and Residuals | |||
| Time or Index | Actuals | Interpolation Forecast | Residuals Prediction Error |
| 1 | 25 | 28.8547756362267 | -3.85477563622669 |
| 2 | 24 | 28.3308335186157 | -4.33083351861573 |
| 3 | 30 | 28.4534321517778 | 1.54656784822216 |
| 4 | 2 | 24.3777109480598 | -22.3777109480598 |
| 5 | 40 | 28.3745577336477 | 11.6254422663523 |
| 6 | 37 | 23.87984699706 | 13.1201530029399 |
| 7 | 16 | 24.8356087243191 | -8.83560872431915 |
| 8 | 22 | 20.1843789093607 | 1.81562109063934 |
| 9 | 33 | 21.1811709857444 | 11.8188290142556 |
| 10 | 17 | 16.9448033423599 | 0.055196657640077 |
| 11 | 28 | 18.4756990437513 | 9.52430095624872 |
| 12 | 27 | 15.9068010043778 | 11.0931989956222 |
| 13 | 14 | 17.1533046707181 | -3.15330467071809 |
| 14 | 13 | 14.1556339406912 | -1.15563394069125 |
| 15 | 4 | 15.9555481499098 | -11.9555481499098 |
| 16 | 21 | 13.2861311082879 | 7.71386889171213 |
| 17 | 23 | 24.27206003015 | -1.27206003014995 |
| 18 | 35 | 25.9104891798774 | 9.08951082012257 |
| 19 | 19 | 28.8648791386409 | -9.86487913864087 |
| 20 | 34 | 18.4681951545627 | 15.5318048454373 |
| 21 | 31 | 24.8754357470613 | 6.12456425293871 |
| 22 | 9 | 23.1137889174103 | -14.1137889174103 |
| 23 | 38 | 20.3155007495907 | 17.6844992504093 |
| 24 | 15 | 14.2387433285472 | 0.761256671452779 |
| 25 | 39 | 26.3452139970089 | 12.6547860029911 |
| 26 | 8 | 20.465169925779 | -12.465169925779 |
| 27 | 26 | 22.5845925006498 | 3.4154074993502 |
| 28 | 11 | 18.9144103073261 | -7.91441030732609 |
| 29 | 6 | 19.9351265599296 | -13.9351265599296 |
| 30 | 20 | 17.5580256826278 | 2.44197431737223 |
| 31 | 10 | 18.8733310457819 | -8.8733310457819 |
| 32 | 32 | 18.6152745999646 | 13.3847254000354 |
| 33 | 1 | 17.0220159108372 | -16.0220159108372 |
| 34 | 3 | 16.820222279018 | -13.820222279018 |
| 35 | 5 | 16.8855511526285 | -11.8855511526285 |
| 36 | 7 | 17.4807697788578 | -10.4807697788578 |
| 37 | 12 | 17.2470375866068 | -5.24703758660677 |
| 38 | 18 | 16.5197094604095 | 1.48029053959045 |
| 39 | 29 | 16.6053628724767 | 12.3946371275233 |
| 40 | 36 | 17.7188572293495 | 18.2811427706505 |
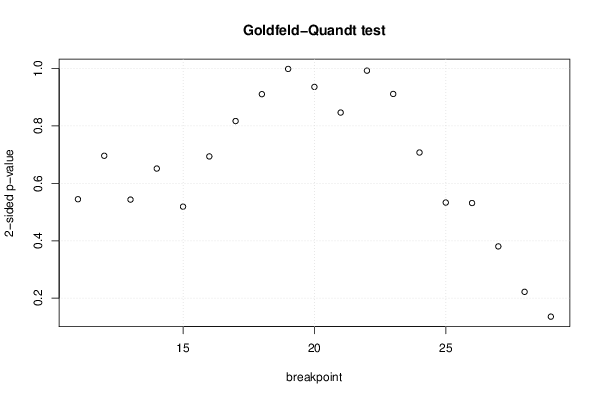
| Goldfeld-Quandt test for Heteroskedasticity | |||
| p-values | Alternative Hypothesis | ||
| breakpoint index | greater | 2-sided | less |
| 11 | 0.727637757049513 | 0.544724485900974 | 0.272362242950487 |
| 12 | 0.651902047908288 | 0.696195904183425 | 0.348097952091712 |
| 13 | 0.728284546511304 | 0.543430906977392 | 0.271715453488696 |
| 14 | 0.674198149405137 | 0.651603701189726 | 0.325801850594863 |
| 15 | 0.740584951354128 | 0.518830097291743 | 0.259415048645872 |
| 16 | 0.653059012699293 | 0.693881974601414 | 0.346940987300707 |
| 17 | 0.591398646045767 | 0.817202707908466 | 0.408601353954233 |
| 18 | 0.544558063313144 | 0.910883873373711 | 0.455441936686856 |
| 19 | 0.500592956220429 | 0.998814087559141 | 0.499407043779571 |
| 20 | 0.531876222462164 | 0.936247555075671 | 0.468123777537836 |
| 21 | 0.42340486621388 | 0.846809732427761 | 0.57659513378612 |
| 22 | 0.503582116901811 | 0.992835766196379 | 0.496417883098189 |
| 23 | 0.455805505213517 | 0.911611010427034 | 0.544194494786483 |
| 24 | 0.353754920213109 | 0.707509840426218 | 0.646245079786891 |
| 25 | 0.266560295669875 | 0.533120591339751 | 0.733439704330125 |
| 26 | 0.265760045214128 | 0.531520090428257 | 0.734239954785872 |
| 27 | 0.190126858870233 | 0.380253717740466 | 0.809873141129767 |
| 28 | 0.11098259370598 | 0.221965187411959 | 0.88901740629402 |
| 29 | 0.0677210513524301 | 0.13544210270486 | 0.93227894864757 |
| Meta Analysis of Goldfeld-Quandt test for Heteroskedasticity | |||
| Description | # significant tests | % significant tests | OK/NOK |
| 1% type I error level | 0 | 0 | OK |
| 5% type I error level | 0 | 0 | OK |
| 10% type I error level | 0 | 0 | OK |