Free Statistics

of Irreproducible Research!

Author's title

Author*The author of this computation has been verified*
R Software Modulerwasp_logisticregression.wasp
Title produced by softwareBias-Reduced Logistic Regression
Date of computationThu, 13 Dec 2012 17:03:36 -0500
Cite this page as followsStatistical Computations at FreeStatistics.org, Office for Research Development and Education, URL https://freestatistics.org/blog/index.php?v=date/2012/Dec/13/t135543624272nkx8ae852c2to.htm/, Retrieved Mon, 29 Apr 2024 05:45:52 +0000
Statistical Computations at FreeStatistics.org, Office for Research Development and Education, URL https://freestatistics.org/blog/index.php?pk=199445, Retrieved Mon, 29 Apr 2024 05:45:52 +0000
QR Codes:

Original text written by user:
IsPrivate?No (this computation is public)
User-defined keywords
Estimated Impact101
Family? (F = Feedback message, R = changed R code, M = changed R Module, P = changed Parameters, D = changed Data)
-       [Bias-Reduced Logistic Regression] [] [2012-12-13 22:03:36] [acfd67cb214b61d0a5e0fb4c8c6ef02a] [Current]
Feedback Forum

Post a new message
Dataseries X:
0	0	0	1	0
0	1	0	1	1
0	0	0	0	0
0	0	0	0	0
1	0	0	0	0
0	0	0	1	1
1	0	0	1	0
0	0	0	0	0
0	0	0	0	1
0	0	0	0	0
0	0	0	1	1
0	0	0	0	0
0	0	0	1	0
0	0	0	0	0
0	0	0	1	0
0	0	0	0	0
0	0	0	0	0
0	0	0	0	0
0	1	0	0	1
0	0	0	0	0
0	0	0	0	0
0	1	0	1	1
0	0	0	0	0
0	0	0	1	0
1	1	0	1	1
0	0	0	0	1
0	1	0	0	0
0	1	0	1	1
0	0	0	1	0
0	0	0	0	0
0	0	0	1	0
0	0	0	1	0
0	0	0	0	0
0	0	0	0	0
0	0	0	1	0
0	0	0	0	0
0	1	0	1	1
1	1	0	0	0
0	0	0	0	0
0	0	0	0	1
1	0	0	0	0
0	0	0	0	0
0	0	0	0	0
0	0	0	0	0
0	0	0	1	0
0	0	0	1	0
0	1	0	1	0
0	0	0	0	0
0	0	0	0	0
0	0	0	0	0
1	1	0	1	0
1	1	0	1	1
0	0	0	0	1
0	0	0	0	0
0	1	1	0	0
0	1	0	0	1
0	0	0	1	0
1	0	0	0	0
1	0	0	0	0
0	0	0	0	1
0	1	0	0	1
0	0	0	0	1
0	0	0	1	0
1	0	0	0	0
0	0	0	0	0
0	1	1	1	0
1	1	1	1	0
0	1	0	1	0


Summary of computational transaction
Raw Inputview raw input (R code)
Raw Outputview raw output of R engine
Computing time2 seconds
R Server'Gertrude Mary Cox' @ cox.wessa.net

\begin{tabular}{lllllllll}
\hline
Summary of computational transaction \tabularnewline
Raw Input & view raw input (R code)  \tabularnewline
Raw Output & view raw output of R engine  \tabularnewline
Computing time & 2 seconds \tabularnewline
R Server & 'Gertrude Mary Cox' @ cox.wessa.net \tabularnewline
\hline
\end{tabular}
%Source: https://freestatistics.org/blog/index.php?pk=199445&T=0

[TABLE]
[ROW][C]Summary of computational transaction[/C][/ROW]
[ROW][C]Raw Input[/C][C]view raw input (R code) [/C][/ROW]
[ROW][C]Raw Output[/C][C]view raw output of R engine [/C][/ROW]
[ROW][C]Computing time[/C][C]2 seconds[/C][/ROW]
[ROW][C]R Server[/C][C]'Gertrude Mary Cox' @ cox.wessa.net[/C][/ROW]
[/TABLE]
Source: https://freestatistics.org/blog/index.php?pk=199445&T=0

Globally Unique Identifier (entire table): ba.freestatistics.org/blog/index.php?pk=199445&T=0

As an alternative you can also use a QR Code:  

The GUIDs for individual cells are displayed in the table below:

Summary of computational transaction
Raw Inputview raw input (R code)
Raw Outputview raw output of R engine
Computing time2 seconds
R Server'Gertrude Mary Cox' @ cox.wessa.net


Coefficients of Bias-Reduced Logistic Regression
VariableParameterS.E.t-stat2-sided p-value
(Intercept)-1.776196480068350.471893968768783-3.763973683966790.00036961804818314
X21.58218063783310.8932073688047821.77134749789430.0813394791108766
Y-0.3326125916197651.43646349631413-0.231549630375730.817638262526254
X30.03905890508507240.701982652498790.05564084090402750.955804013413714
X4-1.064847369875960.960839684421704-1.108246658772060.271968385369575

\begin{tabular}{lllllllll}
\hline
Coefficients of Bias-Reduced Logistic Regression \tabularnewline
Variable & Parameter & S.E. & t-stat & 2-sided p-value \tabularnewline
(Intercept) & -1.77619648006835 & 0.471893968768783 & -3.76397368396679 & 0.00036961804818314 \tabularnewline
X2 & 1.5821806378331 & 0.893207368804782 & 1.7713474978943 & 0.0813394791108766 \tabularnewline
Y & -0.332612591619765 & 1.43646349631413 & -0.23154963037573 & 0.817638262526254 \tabularnewline
X3 & 0.0390589050850724 & 0.70198265249879 & 0.0556408409040275 & 0.955804013413714 \tabularnewline
X4 & -1.06484736987596 & 0.960839684421704 & -1.10824665877206 & 0.271968385369575 \tabularnewline
\hline
\end{tabular}
%Source: https://freestatistics.org/blog/index.php?pk=199445&T=1

[TABLE]
[ROW][C]Coefficients of Bias-Reduced Logistic Regression[/C][/ROW]
[ROW][C]Variable[/C][C]Parameter[/C][C]S.E.[/C][C]t-stat[/C][C]2-sided p-value[/C][/ROW]
[ROW][C](Intercept)[/C][C]-1.77619648006835[/C][C]0.471893968768783[/C][C]-3.76397368396679[/C][C]0.00036961804818314[/C][/ROW]
[ROW][C]X2[/C][C]1.5821806378331[/C][C]0.893207368804782[/C][C]1.7713474978943[/C][C]0.0813394791108766[/C][/ROW]
[ROW][C]Y[/C][C]-0.332612591619765[/C][C]1.43646349631413[/C][C]-0.23154963037573[/C][C]0.817638262526254[/C][/ROW]
[ROW][C]X3[/C][C]0.0390589050850724[/C][C]0.70198265249879[/C][C]0.0556408409040275[/C][C]0.955804013413714[/C][/ROW]
[ROW][C]X4[/C][C]-1.06484736987596[/C][C]0.960839684421704[/C][C]-1.10824665877206[/C][C]0.271968385369575[/C][/ROW]
[/TABLE]
Source: https://freestatistics.org/blog/index.php?pk=199445&T=1

Globally Unique Identifier (entire table): ba.freestatistics.org/blog/index.php?pk=199445&T=1

As an alternative you can also use a QR Code:  

The GUIDs for individual cells are displayed in the table below:

Coefficients of Bias-Reduced Logistic Regression
VariableParameterS.E.t-stat2-sided p-value
(Intercept)-1.776196480068350.471893968768783-3.763973683966790.00036961804818314
X21.58218063783310.8932073688047821.77134749789430.0813394791108766
Y-0.3326125916197651.43646349631413-0.231549630375730.817638262526254
X30.03905890508507240.701982652498790.05564084090402750.955804013413714
X4-1.064847369875960.960839684421704-1.108246658772060.271968385369575


Summary of Bias-Reduced Logistic Regression
Deviance55.8671459755606
Penalized deviance52.6384231972497
Residual Degrees of Freedom63
ROC Area0.646730462519936
Hosmer–Lemeshow test
Chi-squareNA
Degrees of FreedomNA
P(>Chi)NA

\begin{tabular}{lllllllll}
\hline
Summary of Bias-Reduced Logistic Regression \tabularnewline
Deviance & 55.8671459755606 \tabularnewline
Penalized deviance & 52.6384231972497 \tabularnewline
Residual Degrees of Freedom & 63 \tabularnewline
ROC Area & 0.646730462519936 \tabularnewline
Hosmer–Lemeshow test \tabularnewline
Chi-square & NA \tabularnewline
Degrees of Freedom & NA \tabularnewline
P(>Chi) & NA \tabularnewline
\hline
\end{tabular}
%Source: https://freestatistics.org/blog/index.php?pk=199445&T=2

[TABLE]
[ROW][C]Summary of Bias-Reduced Logistic Regression[/C][/ROW]
[ROW][C]Deviance[/C][C]55.8671459755606[/C][/ROW]
[ROW][C]Penalized deviance[/C][C]52.6384231972497[/C][/ROW]
[ROW][C]Residual Degrees of Freedom[/C][C]63[/C][/ROW]
[ROW][C]ROC Area[/C][C]0.646730462519936[/C][/ROW]
[ROW][C]Hosmer–Lemeshow test[/C][/ROW]
[ROW][C]Chi-square[/C][C]NA[/C][/ROW]
[ROW][C]Degrees of Freedom[/C][C]NA[/C][/ROW]
[ROW][C]P(>Chi)[/C][C]NA[/C][/ROW]
[/TABLE]
Source: https://freestatistics.org/blog/index.php?pk=199445&T=2

Globally Unique Identifier (entire table): ba.freestatistics.org/blog/index.php?pk=199445&T=2

As an alternative you can also use a QR Code:  

The GUIDs for individual cells are displayed in the table below:

Summary of Bias-Reduced Logistic Regression
Deviance55.8671459755606
Penalized deviance52.6384231972497
Residual Degrees of Freedom63
ROC Area0.646730462519936
Hosmer–Lemeshow test
Chi-squareNA
Degrees of FreedomNA
P(>Chi)NA


Fit of Logistic Regression
IndexActualFittedError
100.149676880784238-0.149676880784238
200.22797089073515-0.22797089073515
300.144773427434127-0.144773427434127
400.144773427434127-0.144773427434127
510.1447734274341270.855226572565873
600.0572170074235246-0.0572170074235246
710.1496768807842380.850323119215762
800.144773427434127-0.144773427434127
900.0551461226892342-0.0551461226892342
1000.144773427434127-0.144773427434127
1100.0572170074235246-0.0572170074235246
1200.144773427434127-0.144773427434127
1300.149676880784238-0.149676880784238
1400.144773427434127-0.144773427434127
1500.149676880784238-0.149676880784238
1600.144773427434127-0.144773427434127
1700.144773427434127-0.144773427434127
1800.144773427434127-0.144773427434127
1900.221169645995418-0.221169645995418
2000.144773427434127-0.144773427434127
2100.144773427434127-0.144773427434127
2200.22797089073515-0.22797089073515
2300.144773427434127-0.144773427434127
2400.149676880784238-0.149676880784238
2510.227970890735150.77202910926485
2600.0551461226892342-0.0551461226892342
2700.451647618325887-0.451647618325887
2800.22797089073515-0.22797089073515
2900.149676880784238-0.149676880784238
3000.144773427434127-0.144773427434127
3100.149676880784238-0.149676880784238
3200.149676880784238-0.149676880784238
3300.144773427434127-0.144773427434127
3400.144773427434127-0.144773427434127
3500.149676880784238-0.149676880784238
3600.144773427434127-0.144773427434127
3700.22797089073515-0.22797089073515
3810.4516476183258870.548352381674113
3900.144773427434127-0.144773427434127
4000.0551461226892342-0.0551461226892342
4110.1447734274341270.855226572565873
4200.144773427434127-0.144773427434127
4300.144773427434127-0.144773427434127
4400.144773427434127-0.144773427434127
4500.149676880784238-0.149676880784238
4600.149676880784238-0.149676880784238
4700.461338096120244-0.461338096120244
4800.144773427434127-0.144773427434127
4900.144773427434127-0.144773427434127
5000.144773427434127-0.144773427434127
5110.4613380961202440.538661903879756
5210.227970890735150.77202910926485
5300.0551461226892342-0.0551461226892342
5400.144773427434127-0.144773427434127
5500.371303595008228-0.371303595008228
5600.221169645995418-0.221169645995418
5700.149676880784238-0.149676880784238
5810.1447734274341270.855226572565873
5910.1447734274341270.855226572565873
6000.0551461226892342-0.0551461226892342
6100.221169645995418-0.221169645995418
6200.0551461226892342-0.0551461226892342
6300.149676880784238-0.149676880784238
6410.1447734274341270.855226572565873
6500.144773427434127-0.144773427434127
6600.380466291472671-0.380466291472671
6710.3804662914726710.619533708527329
6800.461338096120244-0.461338096120244

\begin{tabular}{lllllllll}
\hline
Fit of Logistic Regression \tabularnewline
Index & Actual & Fitted & Error \tabularnewline
1 & 0 & 0.149676880784238 & -0.149676880784238 \tabularnewline
2 & 0 & 0.22797089073515 & -0.22797089073515 \tabularnewline
3 & 0 & 0.144773427434127 & -0.144773427434127 \tabularnewline
4 & 0 & 0.144773427434127 & -0.144773427434127 \tabularnewline
5 & 1 & 0.144773427434127 & 0.855226572565873 \tabularnewline
6 & 0 & 0.0572170074235246 & -0.0572170074235246 \tabularnewline
7 & 1 & 0.149676880784238 & 0.850323119215762 \tabularnewline
8 & 0 & 0.144773427434127 & -0.144773427434127 \tabularnewline
9 & 0 & 0.0551461226892342 & -0.0551461226892342 \tabularnewline
10 & 0 & 0.144773427434127 & -0.144773427434127 \tabularnewline
11 & 0 & 0.0572170074235246 & -0.0572170074235246 \tabularnewline
12 & 0 & 0.144773427434127 & -0.144773427434127 \tabularnewline
13 & 0 & 0.149676880784238 & -0.149676880784238 \tabularnewline
14 & 0 & 0.144773427434127 & -0.144773427434127 \tabularnewline
15 & 0 & 0.149676880784238 & -0.149676880784238 \tabularnewline
16 & 0 & 0.144773427434127 & -0.144773427434127 \tabularnewline
17 & 0 & 0.144773427434127 & -0.144773427434127 \tabularnewline
18 & 0 & 0.144773427434127 & -0.144773427434127 \tabularnewline
19 & 0 & 0.221169645995418 & -0.221169645995418 \tabularnewline
20 & 0 & 0.144773427434127 & -0.144773427434127 \tabularnewline
21 & 0 & 0.144773427434127 & -0.144773427434127 \tabularnewline
22 & 0 & 0.22797089073515 & -0.22797089073515 \tabularnewline
23 & 0 & 0.144773427434127 & -0.144773427434127 \tabularnewline
24 & 0 & 0.149676880784238 & -0.149676880784238 \tabularnewline
25 & 1 & 0.22797089073515 & 0.77202910926485 \tabularnewline
26 & 0 & 0.0551461226892342 & -0.0551461226892342 \tabularnewline
27 & 0 & 0.451647618325887 & -0.451647618325887 \tabularnewline
28 & 0 & 0.22797089073515 & -0.22797089073515 \tabularnewline
29 & 0 & 0.149676880784238 & -0.149676880784238 \tabularnewline
30 & 0 & 0.144773427434127 & -0.144773427434127 \tabularnewline
31 & 0 & 0.149676880784238 & -0.149676880784238 \tabularnewline
32 & 0 & 0.149676880784238 & -0.149676880784238 \tabularnewline
33 & 0 & 0.144773427434127 & -0.144773427434127 \tabularnewline
34 & 0 & 0.144773427434127 & -0.144773427434127 \tabularnewline
35 & 0 & 0.149676880784238 & -0.149676880784238 \tabularnewline
36 & 0 & 0.144773427434127 & -0.144773427434127 \tabularnewline
37 & 0 & 0.22797089073515 & -0.22797089073515 \tabularnewline
38 & 1 & 0.451647618325887 & 0.548352381674113 \tabularnewline
39 & 0 & 0.144773427434127 & -0.144773427434127 \tabularnewline
40 & 0 & 0.0551461226892342 & -0.0551461226892342 \tabularnewline
41 & 1 & 0.144773427434127 & 0.855226572565873 \tabularnewline
42 & 0 & 0.144773427434127 & -0.144773427434127 \tabularnewline
43 & 0 & 0.144773427434127 & -0.144773427434127 \tabularnewline
44 & 0 & 0.144773427434127 & -0.144773427434127 \tabularnewline
45 & 0 & 0.149676880784238 & -0.149676880784238 \tabularnewline
46 & 0 & 0.149676880784238 & -0.149676880784238 \tabularnewline
47 & 0 & 0.461338096120244 & -0.461338096120244 \tabularnewline
48 & 0 & 0.144773427434127 & -0.144773427434127 \tabularnewline
49 & 0 & 0.144773427434127 & -0.144773427434127 \tabularnewline
50 & 0 & 0.144773427434127 & -0.144773427434127 \tabularnewline
51 & 1 & 0.461338096120244 & 0.538661903879756 \tabularnewline
52 & 1 & 0.22797089073515 & 0.77202910926485 \tabularnewline
53 & 0 & 0.0551461226892342 & -0.0551461226892342 \tabularnewline
54 & 0 & 0.144773427434127 & -0.144773427434127 \tabularnewline
55 & 0 & 0.371303595008228 & -0.371303595008228 \tabularnewline
56 & 0 & 0.221169645995418 & -0.221169645995418 \tabularnewline
57 & 0 & 0.149676880784238 & -0.149676880784238 \tabularnewline
58 & 1 & 0.144773427434127 & 0.855226572565873 \tabularnewline
59 & 1 & 0.144773427434127 & 0.855226572565873 \tabularnewline
60 & 0 & 0.0551461226892342 & -0.0551461226892342 \tabularnewline
61 & 0 & 0.221169645995418 & -0.221169645995418 \tabularnewline
62 & 0 & 0.0551461226892342 & -0.0551461226892342 \tabularnewline
63 & 0 & 0.149676880784238 & -0.149676880784238 \tabularnewline
64 & 1 & 0.144773427434127 & 0.855226572565873 \tabularnewline
65 & 0 & 0.144773427434127 & -0.144773427434127 \tabularnewline
66 & 0 & 0.380466291472671 & -0.380466291472671 \tabularnewline
67 & 1 & 0.380466291472671 & 0.619533708527329 \tabularnewline
68 & 0 & 0.461338096120244 & -0.461338096120244 \tabularnewline
\hline
\end{tabular}
%Source: https://freestatistics.org/blog/index.php?pk=199445&T=3

[TABLE]
[ROW][C]Fit of Logistic Regression[/C][/ROW]
[ROW][C]Index[/C][C]Actual[/C][C]Fitted[/C][C]Error[/C][/ROW]
[ROW][C]1[/C][C]0[/C][C]0.149676880784238[/C][C]-0.149676880784238[/C][/ROW]
[ROW][C]2[/C][C]0[/C][C]0.22797089073515[/C][C]-0.22797089073515[/C][/ROW]
[ROW][C]3[/C][C]0[/C][C]0.144773427434127[/C][C]-0.144773427434127[/C][/ROW]
[ROW][C]4[/C][C]0[/C][C]0.144773427434127[/C][C]-0.144773427434127[/C][/ROW]
[ROW][C]5[/C][C]1[/C][C]0.144773427434127[/C][C]0.855226572565873[/C][/ROW]
[ROW][C]6[/C][C]0[/C][C]0.0572170074235246[/C][C]-0.0572170074235246[/C][/ROW]
[ROW][C]7[/C][C]1[/C][C]0.149676880784238[/C][C]0.850323119215762[/C][/ROW]
[ROW][C]8[/C][C]0[/C][C]0.144773427434127[/C][C]-0.144773427434127[/C][/ROW]
[ROW][C]9[/C][C]0[/C][C]0.0551461226892342[/C][C]-0.0551461226892342[/C][/ROW]
[ROW][C]10[/C][C]0[/C][C]0.144773427434127[/C][C]-0.144773427434127[/C][/ROW]
[ROW][C]11[/C][C]0[/C][C]0.0572170074235246[/C][C]-0.0572170074235246[/C][/ROW]
[ROW][C]12[/C][C]0[/C][C]0.144773427434127[/C][C]-0.144773427434127[/C][/ROW]
[ROW][C]13[/C][C]0[/C][C]0.149676880784238[/C][C]-0.149676880784238[/C][/ROW]
[ROW][C]14[/C][C]0[/C][C]0.144773427434127[/C][C]-0.144773427434127[/C][/ROW]
[ROW][C]15[/C][C]0[/C][C]0.149676880784238[/C][C]-0.149676880784238[/C][/ROW]
[ROW][C]16[/C][C]0[/C][C]0.144773427434127[/C][C]-0.144773427434127[/C][/ROW]
[ROW][C]17[/C][C]0[/C][C]0.144773427434127[/C][C]-0.144773427434127[/C][/ROW]
[ROW][C]18[/C][C]0[/C][C]0.144773427434127[/C][C]-0.144773427434127[/C][/ROW]
[ROW][C]19[/C][C]0[/C][C]0.221169645995418[/C][C]-0.221169645995418[/C][/ROW]
[ROW][C]20[/C][C]0[/C][C]0.144773427434127[/C][C]-0.144773427434127[/C][/ROW]
[ROW][C]21[/C][C]0[/C][C]0.144773427434127[/C][C]-0.144773427434127[/C][/ROW]
[ROW][C]22[/C][C]0[/C][C]0.22797089073515[/C][C]-0.22797089073515[/C][/ROW]
[ROW][C]23[/C][C]0[/C][C]0.144773427434127[/C][C]-0.144773427434127[/C][/ROW]
[ROW][C]24[/C][C]0[/C][C]0.149676880784238[/C][C]-0.149676880784238[/C][/ROW]
[ROW][C]25[/C][C]1[/C][C]0.22797089073515[/C][C]0.77202910926485[/C][/ROW]
[ROW][C]26[/C][C]0[/C][C]0.0551461226892342[/C][C]-0.0551461226892342[/C][/ROW]
[ROW][C]27[/C][C]0[/C][C]0.451647618325887[/C][C]-0.451647618325887[/C][/ROW]
[ROW][C]28[/C][C]0[/C][C]0.22797089073515[/C][C]-0.22797089073515[/C][/ROW]
[ROW][C]29[/C][C]0[/C][C]0.149676880784238[/C][C]-0.149676880784238[/C][/ROW]
[ROW][C]30[/C][C]0[/C][C]0.144773427434127[/C][C]-0.144773427434127[/C][/ROW]
[ROW][C]31[/C][C]0[/C][C]0.149676880784238[/C][C]-0.149676880784238[/C][/ROW]
[ROW][C]32[/C][C]0[/C][C]0.149676880784238[/C][C]-0.149676880784238[/C][/ROW]
[ROW][C]33[/C][C]0[/C][C]0.144773427434127[/C][C]-0.144773427434127[/C][/ROW]
[ROW][C]34[/C][C]0[/C][C]0.144773427434127[/C][C]-0.144773427434127[/C][/ROW]
[ROW][C]35[/C][C]0[/C][C]0.149676880784238[/C][C]-0.149676880784238[/C][/ROW]
[ROW][C]36[/C][C]0[/C][C]0.144773427434127[/C][C]-0.144773427434127[/C][/ROW]
[ROW][C]37[/C][C]0[/C][C]0.22797089073515[/C][C]-0.22797089073515[/C][/ROW]
[ROW][C]38[/C][C]1[/C][C]0.451647618325887[/C][C]0.548352381674113[/C][/ROW]
[ROW][C]39[/C][C]0[/C][C]0.144773427434127[/C][C]-0.144773427434127[/C][/ROW]
[ROW][C]40[/C][C]0[/C][C]0.0551461226892342[/C][C]-0.0551461226892342[/C][/ROW]
[ROW][C]41[/C][C]1[/C][C]0.144773427434127[/C][C]0.855226572565873[/C][/ROW]
[ROW][C]42[/C][C]0[/C][C]0.144773427434127[/C][C]-0.144773427434127[/C][/ROW]
[ROW][C]43[/C][C]0[/C][C]0.144773427434127[/C][C]-0.144773427434127[/C][/ROW]
[ROW][C]44[/C][C]0[/C][C]0.144773427434127[/C][C]-0.144773427434127[/C][/ROW]
[ROW][C]45[/C][C]0[/C][C]0.149676880784238[/C][C]-0.149676880784238[/C][/ROW]
[ROW][C]46[/C][C]0[/C][C]0.149676880784238[/C][C]-0.149676880784238[/C][/ROW]
[ROW][C]47[/C][C]0[/C][C]0.461338096120244[/C][C]-0.461338096120244[/C][/ROW]
[ROW][C]48[/C][C]0[/C][C]0.144773427434127[/C][C]-0.144773427434127[/C][/ROW]
[ROW][C]49[/C][C]0[/C][C]0.144773427434127[/C][C]-0.144773427434127[/C][/ROW]
[ROW][C]50[/C][C]0[/C][C]0.144773427434127[/C][C]-0.144773427434127[/C][/ROW]
[ROW][C]51[/C][C]1[/C][C]0.461338096120244[/C][C]0.538661903879756[/C][/ROW]
[ROW][C]52[/C][C]1[/C][C]0.22797089073515[/C][C]0.77202910926485[/C][/ROW]
[ROW][C]53[/C][C]0[/C][C]0.0551461226892342[/C][C]-0.0551461226892342[/C][/ROW]
[ROW][C]54[/C][C]0[/C][C]0.144773427434127[/C][C]-0.144773427434127[/C][/ROW]
[ROW][C]55[/C][C]0[/C][C]0.371303595008228[/C][C]-0.371303595008228[/C][/ROW]
[ROW][C]56[/C][C]0[/C][C]0.221169645995418[/C][C]-0.221169645995418[/C][/ROW]
[ROW][C]57[/C][C]0[/C][C]0.149676880784238[/C][C]-0.149676880784238[/C][/ROW]
[ROW][C]58[/C][C]1[/C][C]0.144773427434127[/C][C]0.855226572565873[/C][/ROW]
[ROW][C]59[/C][C]1[/C][C]0.144773427434127[/C][C]0.855226572565873[/C][/ROW]
[ROW][C]60[/C][C]0[/C][C]0.0551461226892342[/C][C]-0.0551461226892342[/C][/ROW]
[ROW][C]61[/C][C]0[/C][C]0.221169645995418[/C][C]-0.221169645995418[/C][/ROW]
[ROW][C]62[/C][C]0[/C][C]0.0551461226892342[/C][C]-0.0551461226892342[/C][/ROW]
[ROW][C]63[/C][C]0[/C][C]0.149676880784238[/C][C]-0.149676880784238[/C][/ROW]
[ROW][C]64[/C][C]1[/C][C]0.144773427434127[/C][C]0.855226572565873[/C][/ROW]
[ROW][C]65[/C][C]0[/C][C]0.144773427434127[/C][C]-0.144773427434127[/C][/ROW]
[ROW][C]66[/C][C]0[/C][C]0.380466291472671[/C][C]-0.380466291472671[/C][/ROW]
[ROW][C]67[/C][C]1[/C][C]0.380466291472671[/C][C]0.619533708527329[/C][/ROW]
[ROW][C]68[/C][C]0[/C][C]0.461338096120244[/C][C]-0.461338096120244[/C][/ROW]
[/TABLE]
Source: https://freestatistics.org/blog/index.php?pk=199445&T=3

Globally Unique Identifier (entire table): ba.freestatistics.org/blog/index.php?pk=199445&T=3

As an alternative you can also use a QR Code:  

The GUIDs for individual cells are displayed in the table below:

Fit of Logistic Regression
IndexActualFittedError
100.149676880784238-0.149676880784238
200.22797089073515-0.22797089073515
300.144773427434127-0.144773427434127
400.144773427434127-0.144773427434127
510.1447734274341270.855226572565873
600.0572170074235246-0.0572170074235246
710.1496768807842380.850323119215762
800.144773427434127-0.144773427434127
900.0551461226892342-0.0551461226892342
1000.144773427434127-0.144773427434127
1100.0572170074235246-0.0572170074235246
1200.144773427434127-0.144773427434127
1300.149676880784238-0.149676880784238
1400.144773427434127-0.144773427434127
1500.149676880784238-0.149676880784238
1600.144773427434127-0.144773427434127
1700.144773427434127-0.144773427434127
1800.144773427434127-0.144773427434127
1900.221169645995418-0.221169645995418
2000.144773427434127-0.144773427434127
2100.144773427434127-0.144773427434127
2200.22797089073515-0.22797089073515
2300.144773427434127-0.144773427434127
2400.149676880784238-0.149676880784238
2510.227970890735150.77202910926485
2600.0551461226892342-0.0551461226892342
2700.451647618325887-0.451647618325887
2800.22797089073515-0.22797089073515
2900.149676880784238-0.149676880784238
3000.144773427434127-0.144773427434127
3100.149676880784238-0.149676880784238
3200.149676880784238-0.149676880784238
3300.144773427434127-0.144773427434127
3400.144773427434127-0.144773427434127
3500.149676880784238-0.149676880784238
3600.144773427434127-0.144773427434127
3700.22797089073515-0.22797089073515
3810.4516476183258870.548352381674113
3900.144773427434127-0.144773427434127
4000.0551461226892342-0.0551461226892342
4110.1447734274341270.855226572565873
4200.144773427434127-0.144773427434127
4300.144773427434127-0.144773427434127
4400.144773427434127-0.144773427434127
4500.149676880784238-0.149676880784238
4600.149676880784238-0.149676880784238
4700.461338096120244-0.461338096120244
4800.144773427434127-0.144773427434127
4900.144773427434127-0.144773427434127
5000.144773427434127-0.144773427434127
5110.4613380961202440.538661903879756
5210.227970890735150.77202910926485
5300.0551461226892342-0.0551461226892342
5400.144773427434127-0.144773427434127
5500.371303595008228-0.371303595008228
5600.221169645995418-0.221169645995418
5700.149676880784238-0.149676880784238
5810.1447734274341270.855226572565873
5910.1447734274341270.855226572565873
6000.0551461226892342-0.0551461226892342
6100.221169645995418-0.221169645995418
6200.0551461226892342-0.0551461226892342
6300.149676880784238-0.149676880784238
6410.1447734274341270.855226572565873
6500.144773427434127-0.144773427434127
6600.380466291472671-0.380466291472671
6710.3804662914726710.619533708527329
6800.461338096120244-0.461338096120244


Type I & II errors for various threshold values
ThresholdType IType II
0.0101
0.0201
0.0301
0.0401
0.0501
0.0600.859649122807018
0.0700.859649122807018
0.0800.859649122807018
0.0900.859649122807018
0.100.859649122807018
0.1100.859649122807018
0.1200.859649122807018
0.1300.859649122807018
0.1400.859649122807018
0.150.5454545454545450.210526315789474
0.160.5454545454545450.210526315789474
0.170.5454545454545450.210526315789474
0.180.5454545454545450.210526315789474
0.190.5454545454545450.210526315789474
0.20.5454545454545450.210526315789474
0.210.5454545454545450.210526315789474
0.220.5454545454545450.210526315789474
0.230.7272727272727270.087719298245614
0.240.7272727272727270.087719298245614
0.250.7272727272727270.087719298245614
0.260.7272727272727270.087719298245614
0.270.7272727272727270.087719298245614
0.280.7272727272727270.087719298245614
0.290.7272727272727270.087719298245614
0.30.7272727272727270.087719298245614
0.310.7272727272727270.087719298245614
0.320.7272727272727270.087719298245614
0.330.7272727272727270.087719298245614
0.340.7272727272727270.087719298245614
0.350.7272727272727270.087719298245614
0.360.7272727272727270.087719298245614
0.370.7272727272727270.087719298245614
0.380.7272727272727270.0701754385964912
0.390.8181818181818180.0526315789473684
0.40.8181818181818180.0526315789473684
0.410.8181818181818180.0526315789473684
0.420.8181818181818180.0526315789473684
0.430.8181818181818180.0526315789473684
0.440.8181818181818180.0526315789473684
0.450.8181818181818180.0526315789473684
0.460.9090909090909090.0350877192982456
0.4710
0.4810
0.4910
0.510
0.5110
0.5210
0.5310
0.5410
0.5510
0.5610
0.5710
0.5810
0.5910
0.610
0.6110
0.6210
0.6310
0.6410
0.6510
0.6610
0.6710
0.6810
0.6910
0.710
0.7110
0.7210
0.7310
0.7410
0.7510
0.7610
0.7710
0.7810
0.7910
0.810
0.8110
0.8210
0.8310
0.8410
0.8510
0.8610
0.8710
0.8810
0.8910
0.910
0.9110
0.9210
0.9310
0.9410
0.9510
0.9610
0.9710
0.9810
0.9910

\begin{tabular}{lllllllll}
\hline
Type I & II errors for various threshold values \tabularnewline
Threshold & Type I & Type II \tabularnewline
0.01 & 0 & 1 \tabularnewline
0.02 & 0 & 1 \tabularnewline
0.03 & 0 & 1 \tabularnewline
0.04 & 0 & 1 \tabularnewline
0.05 & 0 & 1 \tabularnewline
0.06 & 0 & 0.859649122807018 \tabularnewline
0.07 & 0 & 0.859649122807018 \tabularnewline
0.08 & 0 & 0.859649122807018 \tabularnewline
0.09 & 0 & 0.859649122807018 \tabularnewline
0.1 & 0 & 0.859649122807018 \tabularnewline
0.11 & 0 & 0.859649122807018 \tabularnewline
0.12 & 0 & 0.859649122807018 \tabularnewline
0.13 & 0 & 0.859649122807018 \tabularnewline
0.14 & 0 & 0.859649122807018 \tabularnewline
0.15 & 0.545454545454545 & 0.210526315789474 \tabularnewline
0.16 & 0.545454545454545 & 0.210526315789474 \tabularnewline
0.17 & 0.545454545454545 & 0.210526315789474 \tabularnewline
0.18 & 0.545454545454545 & 0.210526315789474 \tabularnewline
0.19 & 0.545454545454545 & 0.210526315789474 \tabularnewline
0.2 & 0.545454545454545 & 0.210526315789474 \tabularnewline
0.21 & 0.545454545454545 & 0.210526315789474 \tabularnewline
0.22 & 0.545454545454545 & 0.210526315789474 \tabularnewline
0.23 & 0.727272727272727 & 0.087719298245614 \tabularnewline
0.24 & 0.727272727272727 & 0.087719298245614 \tabularnewline
0.25 & 0.727272727272727 & 0.087719298245614 \tabularnewline
0.26 & 0.727272727272727 & 0.087719298245614 \tabularnewline
0.27 & 0.727272727272727 & 0.087719298245614 \tabularnewline
0.28 & 0.727272727272727 & 0.087719298245614 \tabularnewline
0.29 & 0.727272727272727 & 0.087719298245614 \tabularnewline
0.3 & 0.727272727272727 & 0.087719298245614 \tabularnewline
0.31 & 0.727272727272727 & 0.087719298245614 \tabularnewline
0.32 & 0.727272727272727 & 0.087719298245614 \tabularnewline
0.33 & 0.727272727272727 & 0.087719298245614 \tabularnewline
0.34 & 0.727272727272727 & 0.087719298245614 \tabularnewline
0.35 & 0.727272727272727 & 0.087719298245614 \tabularnewline
0.36 & 0.727272727272727 & 0.087719298245614 \tabularnewline
0.37 & 0.727272727272727 & 0.087719298245614 \tabularnewline
0.38 & 0.727272727272727 & 0.0701754385964912 \tabularnewline
0.39 & 0.818181818181818 & 0.0526315789473684 \tabularnewline
0.4 & 0.818181818181818 & 0.0526315789473684 \tabularnewline
0.41 & 0.818181818181818 & 0.0526315789473684 \tabularnewline
0.42 & 0.818181818181818 & 0.0526315789473684 \tabularnewline
0.43 & 0.818181818181818 & 0.0526315789473684 \tabularnewline
0.44 & 0.818181818181818 & 0.0526315789473684 \tabularnewline
0.45 & 0.818181818181818 & 0.0526315789473684 \tabularnewline
0.46 & 0.909090909090909 & 0.0350877192982456 \tabularnewline
0.47 & 1 & 0 \tabularnewline
0.48 & 1 & 0 \tabularnewline
0.49 & 1 & 0 \tabularnewline
0.5 & 1 & 0 \tabularnewline
0.51 & 1 & 0 \tabularnewline
0.52 & 1 & 0 \tabularnewline
0.53 & 1 & 0 \tabularnewline
0.54 & 1 & 0 \tabularnewline
0.55 & 1 & 0 \tabularnewline
0.56 & 1 & 0 \tabularnewline
0.57 & 1 & 0 \tabularnewline
0.58 & 1 & 0 \tabularnewline
0.59 & 1 & 0 \tabularnewline
0.6 & 1 & 0 \tabularnewline
0.61 & 1 & 0 \tabularnewline
0.62 & 1 & 0 \tabularnewline
0.63 & 1 & 0 \tabularnewline
0.64 & 1 & 0 \tabularnewline
0.65 & 1 & 0 \tabularnewline
0.66 & 1 & 0 \tabularnewline
0.67 & 1 & 0 \tabularnewline
0.68 & 1 & 0 \tabularnewline
0.69 & 1 & 0 \tabularnewline
0.7 & 1 & 0 \tabularnewline
0.71 & 1 & 0 \tabularnewline
0.72 & 1 & 0 \tabularnewline
0.73 & 1 & 0 \tabularnewline
0.74 & 1 & 0 \tabularnewline
0.75 & 1 & 0 \tabularnewline
0.76 & 1 & 0 \tabularnewline
0.77 & 1 & 0 \tabularnewline
0.78 & 1 & 0 \tabularnewline
0.79 & 1 & 0 \tabularnewline
0.8 & 1 & 0 \tabularnewline
0.81 & 1 & 0 \tabularnewline
0.82 & 1 & 0 \tabularnewline
0.83 & 1 & 0 \tabularnewline
0.84 & 1 & 0 \tabularnewline
0.85 & 1 & 0 \tabularnewline
0.86 & 1 & 0 \tabularnewline
0.87 & 1 & 0 \tabularnewline
0.88 & 1 & 0 \tabularnewline
0.89 & 1 & 0 \tabularnewline
0.9 & 1 & 0 \tabularnewline
0.91 & 1 & 0 \tabularnewline
0.92 & 1 & 0 \tabularnewline
0.93 & 1 & 0 \tabularnewline
0.94 & 1 & 0 \tabularnewline
0.95 & 1 & 0 \tabularnewline
0.96 & 1 & 0 \tabularnewline
0.97 & 1 & 0 \tabularnewline
0.98 & 1 & 0 \tabularnewline
0.99 & 1 & 0 \tabularnewline
\hline
\end{tabular}
%Source: https://freestatistics.org/blog/index.php?pk=199445&T=4

[TABLE]
[ROW][C]Type I & II errors for various threshold values[/C][/ROW]
[ROW][C]Threshold[/C][C]Type I[/C][C]Type II[/C][/ROW]
[ROW][C]0.01[/C][C]0[/C][C]1[/C][/ROW]
[ROW][C]0.02[/C][C]0[/C][C]1[/C][/ROW]
[ROW][C]0.03[/C][C]0[/C][C]1[/C][/ROW]
[ROW][C]0.04[/C][C]0[/C][C]1[/C][/ROW]
[ROW][C]0.05[/C][C]0[/C][C]1[/C][/ROW]
[ROW][C]0.06[/C][C]0[/C][C]0.859649122807018[/C][/ROW]
[ROW][C]0.07[/C][C]0[/C][C]0.859649122807018[/C][/ROW]
[ROW][C]0.08[/C][C]0[/C][C]0.859649122807018[/C][/ROW]
[ROW][C]0.09[/C][C]0[/C][C]0.859649122807018[/C][/ROW]
[ROW][C]0.1[/C][C]0[/C][C]0.859649122807018[/C][/ROW]
[ROW][C]0.11[/C][C]0[/C][C]0.859649122807018[/C][/ROW]
[ROW][C]0.12[/C][C]0[/C][C]0.859649122807018[/C][/ROW]
[ROW][C]0.13[/C][C]0[/C][C]0.859649122807018[/C][/ROW]
[ROW][C]0.14[/C][C]0[/C][C]0.859649122807018[/C][/ROW]
[ROW][C]0.15[/C][C]0.545454545454545[/C][C]0.210526315789474[/C][/ROW]
[ROW][C]0.16[/C][C]0.545454545454545[/C][C]0.210526315789474[/C][/ROW]
[ROW][C]0.17[/C][C]0.545454545454545[/C][C]0.210526315789474[/C][/ROW]
[ROW][C]0.18[/C][C]0.545454545454545[/C][C]0.210526315789474[/C][/ROW]
[ROW][C]0.19[/C][C]0.545454545454545[/C][C]0.210526315789474[/C][/ROW]
[ROW][C]0.2[/C][C]0.545454545454545[/C][C]0.210526315789474[/C][/ROW]
[ROW][C]0.21[/C][C]0.545454545454545[/C][C]0.210526315789474[/C][/ROW]
[ROW][C]0.22[/C][C]0.545454545454545[/C][C]0.210526315789474[/C][/ROW]
[ROW][C]0.23[/C][C]0.727272727272727[/C][C]0.087719298245614[/C][/ROW]
[ROW][C]0.24[/C][C]0.727272727272727[/C][C]0.087719298245614[/C][/ROW]
[ROW][C]0.25[/C][C]0.727272727272727[/C][C]0.087719298245614[/C][/ROW]
[ROW][C]0.26[/C][C]0.727272727272727[/C][C]0.087719298245614[/C][/ROW]
[ROW][C]0.27[/C][C]0.727272727272727[/C][C]0.087719298245614[/C][/ROW]
[ROW][C]0.28[/C][C]0.727272727272727[/C][C]0.087719298245614[/C][/ROW]
[ROW][C]0.29[/C][C]0.727272727272727[/C][C]0.087719298245614[/C][/ROW]
[ROW][C]0.3[/C][C]0.727272727272727[/C][C]0.087719298245614[/C][/ROW]
[ROW][C]0.31[/C][C]0.727272727272727[/C][C]0.087719298245614[/C][/ROW]
[ROW][C]0.32[/C][C]0.727272727272727[/C][C]0.087719298245614[/C][/ROW]
[ROW][C]0.33[/C][C]0.727272727272727[/C][C]0.087719298245614[/C][/ROW]
[ROW][C]0.34[/C][C]0.727272727272727[/C][C]0.087719298245614[/C][/ROW]
[ROW][C]0.35[/C][C]0.727272727272727[/C][C]0.087719298245614[/C][/ROW]
[ROW][C]0.36[/C][C]0.727272727272727[/C][C]0.087719298245614[/C][/ROW]
[ROW][C]0.37[/C][C]0.727272727272727[/C][C]0.087719298245614[/C][/ROW]
[ROW][C]0.38[/C][C]0.727272727272727[/C][C]0.0701754385964912[/C][/ROW]
[ROW][C]0.39[/C][C]0.818181818181818[/C][C]0.0526315789473684[/C][/ROW]
[ROW][C]0.4[/C][C]0.818181818181818[/C][C]0.0526315789473684[/C][/ROW]
[ROW][C]0.41[/C][C]0.818181818181818[/C][C]0.0526315789473684[/C][/ROW]
[ROW][C]0.42[/C][C]0.818181818181818[/C][C]0.0526315789473684[/C][/ROW]
[ROW][C]0.43[/C][C]0.818181818181818[/C][C]0.0526315789473684[/C][/ROW]
[ROW][C]0.44[/C][C]0.818181818181818[/C][C]0.0526315789473684[/C][/ROW]
[ROW][C]0.45[/C][C]0.818181818181818[/C][C]0.0526315789473684[/C][/ROW]
[ROW][C]0.46[/C][C]0.909090909090909[/C][C]0.0350877192982456[/C][/ROW]
[ROW][C]0.47[/C][C]1[/C][C]0[/C][/ROW]
[ROW][C]0.48[/C][C]1[/C][C]0[/C][/ROW]
[ROW][C]0.49[/C][C]1[/C][C]0[/C][/ROW]
[ROW][C]0.5[/C][C]1[/C][C]0[/C][/ROW]
[ROW][C]0.51[/C][C]1[/C][C]0[/C][/ROW]
[ROW][C]0.52[/C][C]1[/C][C]0[/C][/ROW]
[ROW][C]0.53[/C][C]1[/C][C]0[/C][/ROW]
[ROW][C]0.54[/C][C]1[/C][C]0[/C][/ROW]
[ROW][C]0.55[/C][C]1[/C][C]0[/C][/ROW]
[ROW][C]0.56[/C][C]1[/C][C]0[/C][/ROW]
[ROW][C]0.57[/C][C]1[/C][C]0[/C][/ROW]
[ROW][C]0.58[/C][C]1[/C][C]0[/C][/ROW]
[ROW][C]0.59[/C][C]1[/C][C]0[/C][/ROW]
[ROW][C]0.6[/C][C]1[/C][C]0[/C][/ROW]
[ROW][C]0.61[/C][C]1[/C][C]0[/C][/ROW]
[ROW][C]0.62[/C][C]1[/C][C]0[/C][/ROW]
[ROW][C]0.63[/C][C]1[/C][C]0[/C][/ROW]
[ROW][C]0.64[/C][C]1[/C][C]0[/C][/ROW]
[ROW][C]0.65[/C][C]1[/C][C]0[/C][/ROW]
[ROW][C]0.66[/C][C]1[/C][C]0[/C][/ROW]
[ROW][C]0.67[/C][C]1[/C][C]0[/C][/ROW]
[ROW][C]0.68[/C][C]1[/C][C]0[/C][/ROW]
[ROW][C]0.69[/C][C]1[/C][C]0[/C][/ROW]
[ROW][C]0.7[/C][C]1[/C][C]0[/C][/ROW]
[ROW][C]0.71[/C][C]1[/C][C]0[/C][/ROW]
[ROW][C]0.72[/C][C]1[/C][C]0[/C][/ROW]
[ROW][C]0.73[/C][C]1[/C][C]0[/C][/ROW]
[ROW][C]0.74[/C][C]1[/C][C]0[/C][/ROW]
[ROW][C]0.75[/C][C]1[/C][C]0[/C][/ROW]
[ROW][C]0.76[/C][C]1[/C][C]0[/C][/ROW]
[ROW][C]0.77[/C][C]1[/C][C]0[/C][/ROW]
[ROW][C]0.78[/C][C]1[/C][C]0[/C][/ROW]
[ROW][C]0.79[/C][C]1[/C][C]0[/C][/ROW]
[ROW][C]0.8[/C][C]1[/C][C]0[/C][/ROW]
[ROW][C]0.81[/C][C]1[/C][C]0[/C][/ROW]
[ROW][C]0.82[/C][C]1[/C][C]0[/C][/ROW]
[ROW][C]0.83[/C][C]1[/C][C]0[/C][/ROW]
[ROW][C]0.84[/C][C]1[/C][C]0[/C][/ROW]
[ROW][C]0.85[/C][C]1[/C][C]0[/C][/ROW]
[ROW][C]0.86[/C][C]1[/C][C]0[/C][/ROW]
[ROW][C]0.87[/C][C]1[/C][C]0[/C][/ROW]
[ROW][C]0.88[/C][C]1[/C][C]0[/C][/ROW]
[ROW][C]0.89[/C][C]1[/C][C]0[/C][/ROW]
[ROW][C]0.9[/C][C]1[/C][C]0[/C][/ROW]
[ROW][C]0.91[/C][C]1[/C][C]0[/C][/ROW]
[ROW][C]0.92[/C][C]1[/C][C]0[/C][/ROW]
[ROW][C]0.93[/C][C]1[/C][C]0[/C][/ROW]
[ROW][C]0.94[/C][C]1[/C][C]0[/C][/ROW]
[ROW][C]0.95[/C][C]1[/C][C]0[/C][/ROW]
[ROW][C]0.96[/C][C]1[/C][C]0[/C][/ROW]
[ROW][C]0.97[/C][C]1[/C][C]0[/C][/ROW]
[ROW][C]0.98[/C][C]1[/C][C]0[/C][/ROW]
[ROW][C]0.99[/C][C]1[/C][C]0[/C][/ROW]
[/TABLE]
Source: https://freestatistics.org/blog/index.php?pk=199445&T=4

Globally Unique Identifier (entire table): ba.freestatistics.org/blog/index.php?pk=199445&T=4

As an alternative you can also use a QR Code:  

The GUIDs for individual cells are displayed in the table below:

Type I & II errors for various threshold values
ThresholdType IType II
0.0101
0.0201
0.0301
0.0401
0.0501
0.0600.859649122807018
0.0700.859649122807018
0.0800.859649122807018
0.0900.859649122807018
0.100.859649122807018
0.1100.859649122807018
0.1200.859649122807018
0.1300.859649122807018
0.1400.859649122807018
0.150.5454545454545450.210526315789474
0.160.5454545454545450.210526315789474
0.170.5454545454545450.210526315789474
0.180.5454545454545450.210526315789474
0.190.5454545454545450.210526315789474
0.20.5454545454545450.210526315789474
0.210.5454545454545450.210526315789474
0.220.5454545454545450.210526315789474
0.230.7272727272727270.087719298245614
0.240.7272727272727270.087719298245614
0.250.7272727272727270.087719298245614
0.260.7272727272727270.087719298245614
0.270.7272727272727270.087719298245614
0.280.7272727272727270.087719298245614
0.290.7272727272727270.087719298245614
0.30.7272727272727270.087719298245614
0.310.7272727272727270.087719298245614
0.320.7272727272727270.087719298245614
0.330.7272727272727270.087719298245614
0.340.7272727272727270.087719298245614
0.350.7272727272727270.087719298245614
0.360.7272727272727270.087719298245614
0.370.7272727272727270.087719298245614
0.380.7272727272727270.0701754385964912
0.390.8181818181818180.0526315789473684
0.40.8181818181818180.0526315789473684
0.410.8181818181818180.0526315789473684
0.420.8181818181818180.0526315789473684
0.430.8181818181818180.0526315789473684
0.440.8181818181818180.0526315789473684
0.450.8181818181818180.0526315789473684
0.460.9090909090909090.0350877192982456
0.4710
0.4810
0.4910
0.510
0.5110
0.5210
0.5310
0.5410
0.5510
0.5610
0.5710
0.5810
0.5910
0.610
0.6110
0.6210
0.6310
0.6410
0.6510
0.6610
0.6710
0.6810
0.6910
0.710
0.7110
0.7210
0.7310
0.7410
0.7510
0.7610
0.7710
0.7810
0.7910
0.810
0.8110
0.8210
0.8310
0.8410
0.8510
0.8610
0.8710
0.8810
0.8910
0.910
0.9110
0.9210
0.9310
0.9410
0.9510
0.9610
0.9710
0.9810
0.9910


Parameters (Session):
Parameters (R input):
R code (references can be found in the software module):
library(brglm)
roc.plot <- function (sd, sdc, newplot = TRUE, ...)
{
sall <- sort(c(sd, sdc))
sens <- 0
specc <- 0
for (i in length(sall):1) {
sens <- c(sens, mean(sd >= sall[i], na.rm = T))
specc <- c(specc, mean(sdc >= sall[i], na.rm = T))
}
if (newplot) {
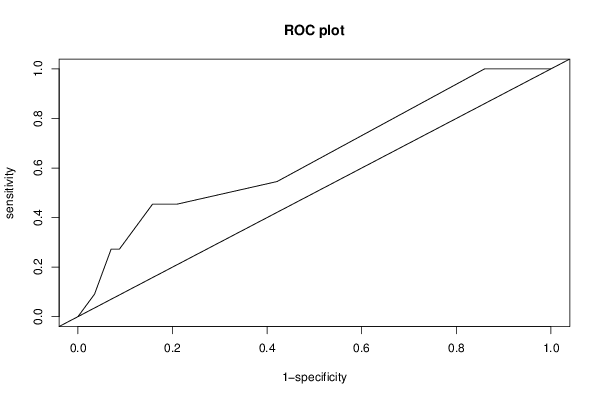
plot(specc, sens, xlim = c(0, 1), ylim = c(0, 1), type = 'l',
xlab = '1-specificity', ylab = 'sensitivity', main = 'ROC plot', ...)
abline(0, 1)
}
else lines(specc, sens, ...)
npoints <- length(sens)
area <- sum(0.5 * (sens[-1] + sens[-npoints]) * (specc[-1] -
specc[-npoints]))
lift <- (sens - specc)[-1]
cutoff <- sall[lift == max(lift)][1]
sensopt <- sens[-1][lift == max(lift)][1]
specopt <- 1 - specc[-1][lift == max(lift)][1]
list(area = area, cutoff = cutoff, sensopt = sensopt, specopt = specopt)
}
roc.analysis <- function (object, newdata = NULL, newplot = TRUE, ...)
{
if (is.null(newdata)) {
sd <- object$fitted[object$y == 1]
sdc <- object$fitted[object$y == 0]
}
else {
sd <- predict(object, newdata, type = 'response')[newdata$y ==
1]
sdc <- predict(object, newdata, type = 'response')[newdata$y ==
0]
}
roc.plot(sd, sdc, newplot, ...)
}
hosmerlem <- function (y, yhat, g = 10)
{
cutyhat <- cut(yhat, breaks = quantile(yhat, probs = seq(0,
1, 1/g)), include.lowest = T)
obs <- xtabs(cbind(1 - y, y) ~ cutyhat)
expect <- xtabs(cbind(1 - yhat, yhat) ~ cutyhat)
chisq <- sum((obs - expect)^2/expect)
P <- 1 - pchisq(chisq, g - 2)
c('X^2' = chisq, Df = g - 2, 'P(>Chi)' = P)
}
x <- as.data.frame(t(y))
r <- brglm(x)
summary(r)
rc <- summary(r)$coeff
try(hm <- hosmerlem(y[1,],r$fitted.values),silent=T)
try(hm,silent=T)
bitmap(file='test0.png')
ra <- roc.analysis(r)
dev.off()
te <- array(0,dim=c(2,99))
for (i in 1:99) {
threshold <- i / 100
numcorr1 <- 0
numfaul1 <- 0
numcorr0 <- 0
numfaul0 <- 0
for (j in 1:length(r$fitted.values)) {
if (y[1,j] > 0.99) {
if (r$fitted.values[j] >= threshold) numcorr1 = numcorr1 + 1 else numfaul1 = numfaul1 + 1
} else {
if (r$fitted.values[j] < threshold) numcorr0 = numcorr0 + 1 else numfaul0 = numfaul0 + 1
}
}
te[1,i] <- numfaul1 / (numfaul1 + numcorr1)
te[2,i] <- numfaul0 / (numfaul0 + numcorr0)
}
bitmap(file='test1.png')
op <- par(mfrow=c(2,2))
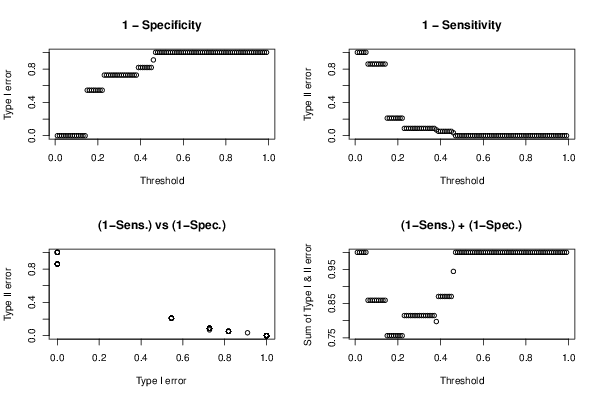
plot((1:99)/100,te[1,],xlab='Threshold',ylab='Type I error', main='1 - Specificity')
plot((1:99)/100,te[2,],xlab='Threshold',ylab='Type II error', main='1 - Sensitivity')
plot(te[1,],te[2,],xlab='Type I error',ylab='Type II error', main='(1-Sens.) vs (1-Spec.)')
plot((1:99)/100,te[1,]+te[2,],xlab='Threshold',ylab='Sum of Type I & II error', main='(1-Sens.) + (1-Spec.)')
par(op)
dev.off()
load(file='createtable')
a<-table.start()
a<-table.row.start(a)
a<-table.element(a,'Coefficients of Bias-Reduced Logistic Regression',5,TRUE)
a<-table.row.end(a)
a<-table.row.start(a)
a<-table.element(a,'Variable',header=TRUE)
a<-table.element(a,'Parameter',header=TRUE)
a<-table.element(a,'S.E.',header=TRUE)
a<-table.element(a,'t-stat',header=TRUE)
a<-table.element(a,'2-sided p-value',header=TRUE)
a<-table.row.end(a)
for (i in 1:length(rc[,1])) {
a<-table.row.start(a)
a<-table.element(a,labels(rc)[[1]][i],header=TRUE)
a<-table.element(a,rc[i,1])
a<-table.element(a,rc[i,2])
a<-table.element(a,rc[i,3])
a<-table.element(a,2*(1-pt(abs(rc[i,3]),r$df.residual)))
a<-table.row.end(a)
}
a<-table.end(a)
table.save(a,file='mytable.tab')
a<-table.start()
a<-table.row.start(a)
a<-table.element(a,'Summary of Bias-Reduced Logistic Regression',2,TRUE)
a<-table.row.end(a)
a<-table.row.start(a)
a<-table.element(a,'Deviance',1,TRUE)
a<-table.element(a,r$deviance)
a<-table.row.end(a)
a<-table.row.start(a)
a<-table.element(a,'Penalized deviance',1,TRUE)
a<-table.element(a,r$penalized.deviance)
a<-table.row.end(a)
a<-table.row.start(a)
a<-table.element(a,'Residual Degrees of Freedom',1,TRUE)
a<-table.element(a,r$df.residual)
a<-table.row.end(a)
a<-table.row.start(a)
a<-table.element(a,'ROC Area',1,TRUE)
a<-table.element(a,ra$area)
a<-table.row.end(a)
a<-table.row.start(a)
a<-table.element(a,'Hosmer–Lemeshow test',2,TRUE)
a<-table.row.end(a)
a<-table.row.start(a)
a<-table.element(a,'Chi-square',1,TRUE)
phm <- array('NA',dim=3)
for (i in 1:3) { try(phm[i] <- hm[i],silent=T) }
a<-table.element(a,phm[1])
a<-table.row.end(a)
a<-table.row.start(a)
a<-table.element(a,'Degrees of Freedom',1,TRUE)
a<-table.element(a,phm[2])
a<-table.row.end(a)
a<-table.row.start(a)
a<-table.element(a,'P(>Chi)',1,TRUE)
a<-table.element(a,phm[3])
a<-table.row.end(a)
a<-table.end(a)
table.save(a,file='mytable1.tab')
a<-table.start()
a<-table.row.start(a)
a<-table.element(a,'Fit of Logistic Regression',4,TRUE)
a<-table.row.end(a)
a<-table.row.start(a)
a<-table.element(a,'Index',1,TRUE)
a<-table.element(a,'Actual',1,TRUE)
a<-table.element(a,'Fitted',1,TRUE)
a<-table.element(a,'Error',1,TRUE)
a<-table.row.end(a)
for (i in 1:length(r$fitted.values)) {
a<-table.row.start(a)
a<-table.element(a,i,1,TRUE)
a<-table.element(a,y[1,i])
a<-table.element(a,r$fitted.values[i])
a<-table.element(a,y[1,i]-r$fitted.values[i])
a<-table.row.end(a)
}
a<-table.end(a)
table.save(a,file='mytable2.tab')
a<-table.start()
a<-table.row.start(a)
a<-table.element(a,'Type I & II errors for various threshold values',3,TRUE)
a<-table.row.end(a)
a<-table.row.start(a)
a<-table.element(a,'Threshold',1,TRUE)
a<-table.element(a,'Type I',1,TRUE)
a<-table.element(a,'Type II',1,TRUE)
a<-table.row.end(a)
for (i in 1:99) {
a<-table.row.start(a)
a<-table.element(a,i/100,1,TRUE)
a<-table.element(a,te[1,i])
a<-table.element(a,te[2,i])
a<-table.row.end(a)
}
a<-table.end(a)
table.save(a,file='mytable3.tab')