Free Statistics

of Irreproducible Research!

Author's title

Author*The author of this computation has been verified*
R Software Modulerwasp_spectrum.wasp
Title produced by softwareSpectral Analysis
Date of computationThu, 13 Dec 2012 16:06:54 -0500
Cite this page as followsStatistical Computations at FreeStatistics.org, Office for Research Development and Education, URL https://freestatistics.org/blog/index.php?v=date/2012/Dec/13/t135543304077hux1107vk9tkp.htm/, Retrieved Sun, 28 Apr 2024 23:08:00 +0000
Statistical Computations at FreeStatistics.org, Office for Research Development and Education, URL https://freestatistics.org/blog/index.php?pk=199422, Retrieved Sun, 28 Apr 2024 23:08:00 +0000
QR Codes:

Original text written by user:
IsPrivate?No (this computation is public)
User-defined keywords
Estimated Impact101
Family? (F = Feedback message, R = changed R code, M = changed R Module, P = changed Parameters, D = changed Data)
-     [(Partial) Autocorrelation Function] [] [2012-11-21 08:39:17] [d2c1a12335a0e7c18f8727e39be21dbc]
- RMPD  [Spectral Analysis] [Paper Spectral an...] [2012-12-13 20:30:48] [86dcce9422b96d4554cb918e531c1d5d]
- R P       [Spectral Analysis] [Paper variance re...] [2012-12-13 21:06:54] [c63d55528b56cf8bb48e0b5d1a959d8e] [Current]
Feedback Forum

Post a new message
Dataseries X:
68.897
38.683
44.720
39.525
45.315
50.380
40.600
36.279
42.438
38.064
31.879
11.379
70.249
39.253
47.060
41.697
38.708
49.267
39.018
32.228
40.870
39.383
34.571
12.066
70.938
34.077
45.409
40.809
37.013
44.953
37.848
32.745
43.412
34.931
33.008
8.620
68.906
39.556
50.669
36.432
40.891
48.428
36.222
33.425
39.401
37.967
34.801
12.657
69.116
41.519
51.321
38.529
41.547
52.073
38.401
40.898
40.439
41.888
37.898
8.771
68.184
50.530
47.221
41.756
45.633
48.138
39.486
39.341
41.117
41.629
29.722
7.054
56.676
34.870
35.117
30.169
30.936
35.699
33.228
27.733
33.666
35.429
27.438
8.170
63.410
38.040
45.389
37.353
37.024
50.957
37.994
36.454
46.080
43.373
37.395
10.963
76.058
50.179
57.452
47.568
50.050
50.856
41.992
39.284
44.521
43.832
41.153
17.100


Summary of computational transaction
Raw Inputview raw input (R code)
Raw Outputview raw output of R engine
Computing time1 seconds
R Server'Gertrude Mary Cox' @ cox.wessa.net

\begin{tabular}{lllllllll}
\hline
Summary of computational transaction \tabularnewline
Raw Input & view raw input (R code)  \tabularnewline
Raw Output & view raw output of R engine  \tabularnewline
Computing time & 1 seconds \tabularnewline
R Server & 'Gertrude Mary Cox' @ cox.wessa.net \tabularnewline
\hline
\end{tabular}
%Source: https://freestatistics.org/blog/index.php?pk=199422&T=0

[TABLE]
[ROW][C]Summary of computational transaction[/C][/ROW]
[ROW][C]Raw Input[/C][C]view raw input (R code) [/C][/ROW]
[ROW][C]Raw Output[/C][C]view raw output of R engine [/C][/ROW]
[ROW][C]Computing time[/C][C]1 seconds[/C][/ROW]
[ROW][C]R Server[/C][C]'Gertrude Mary Cox' @ cox.wessa.net[/C][/ROW]
[/TABLE]
Source: https://freestatistics.org/blog/index.php?pk=199422&T=0

Globally Unique Identifier (entire table): ba.freestatistics.org/blog/index.php?pk=199422&T=0

As an alternative you can also use a QR Code:  

The GUIDs for individual cells are displayed in the table below:

Summary of computational transaction
Raw Inputview raw input (R code)
Raw Outputview raw output of R engine
Computing time1 seconds
R Server'Gertrude Mary Cox' @ cox.wessa.net


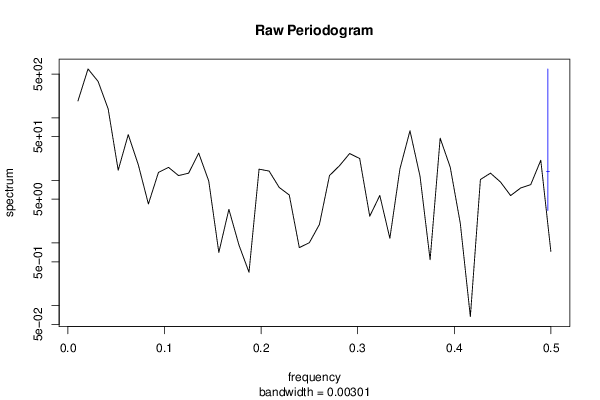
Raw Periodogram
ParameterValue
Box-Cox transformation parameter (lambda)1
Degree of non-seasonal differencing (d)0
Degree of seasonal differencing (D)1
Seasonal Period (s)12
Frequency (Period)Spectrum
0.0104 (96)185.943439
0.0208 (48)603.65277
0.0312 (32)381.802434
0.0417 (24)139.126435
0.0521 (19.2)14.550443
0.0625 (16)53.974294
0.0729 (13.7143)17.719995
0.0833 (12)4.198612
0.0938 (10.6667)13.407726
0.1042 (9.6)16.141986
0.1146 (8.7273)11.928488
0.125 (8)13.043231
0.1354 (7.3846)27.296297
0.1458 (6.8571)9.758186
0.1562 (6.4)0.704475
0.1667 (6)3.447604
0.1771 (5.6471)0.926811
0.1875 (5.3333)0.340569
0.1979 (5.0526)15.125201
0.2083 (4.8)14.080629
0.2188 (4.5714)7.722524
0.2292 (4.3636)5.853157
0.2396 (4.1739)0.842526
0.25 (4)1.009172
0.2604 (3.84)1.979806
0.2708 (3.6923)11.943423
0.2812 (3.5556)17.196368
0.2917 (3.4286)26.872445
0.3021 (3.3103)22.387224
0.3125 (3.2)2.67323
0.3229 (3.0968)5.747329
0.3333 (3)1.186643
0.3438 (2.9091)15.258207
0.3542 (2.8235)62.134057
0.3646 (2.7429)11.574101
0.375 (2.6667)0.537941
0.3854 (2.5946)47.200733
0.3958 (2.5263)16.260721
0.4062 (2.4615)2.05994
0.4167 (2.4)0.06644
0.4271 (2.3415)10.336298
0.4375 (2.2857)13.045738
0.4479 (2.2326)9.403093
0.4583 (2.1818)5.722208
0.4688 (2.1333)7.556462
0.4792 (2.087)8.542596
0.4896 (2.0426)20.984596
0.5 (2)0.732432

\begin{tabular}{lllllllll}
\hline
Raw Periodogram \tabularnewline
Parameter & Value \tabularnewline
Box-Cox transformation parameter (lambda) & 1 \tabularnewline
Degree of non-seasonal differencing (d) & 0 \tabularnewline
Degree of seasonal differencing (D) & 1 \tabularnewline
Seasonal Period (s) & 12 \tabularnewline
Frequency (Period) & Spectrum \tabularnewline
0.0104 (96) & 185.943439 \tabularnewline
0.0208 (48) & 603.65277 \tabularnewline
0.0312 (32) & 381.802434 \tabularnewline
0.0417 (24) & 139.126435 \tabularnewline
0.0521 (19.2) & 14.550443 \tabularnewline
0.0625 (16) & 53.974294 \tabularnewline
0.0729 (13.7143) & 17.719995 \tabularnewline
0.0833 (12) & 4.198612 \tabularnewline
0.0938 (10.6667) & 13.407726 \tabularnewline
0.1042 (9.6) & 16.141986 \tabularnewline
0.1146 (8.7273) & 11.928488 \tabularnewline
0.125 (8) & 13.043231 \tabularnewline
0.1354 (7.3846) & 27.296297 \tabularnewline
0.1458 (6.8571) & 9.758186 \tabularnewline
0.1562 (6.4) & 0.704475 \tabularnewline
0.1667 (6) & 3.447604 \tabularnewline
0.1771 (5.6471) & 0.926811 \tabularnewline
0.1875 (5.3333) & 0.340569 \tabularnewline
0.1979 (5.0526) & 15.125201 \tabularnewline
0.2083 (4.8) & 14.080629 \tabularnewline
0.2188 (4.5714) & 7.722524 \tabularnewline
0.2292 (4.3636) & 5.853157 \tabularnewline
0.2396 (4.1739) & 0.842526 \tabularnewline
0.25 (4) & 1.009172 \tabularnewline
0.2604 (3.84) & 1.979806 \tabularnewline
0.2708 (3.6923) & 11.943423 \tabularnewline
0.2812 (3.5556) & 17.196368 \tabularnewline
0.2917 (3.4286) & 26.872445 \tabularnewline
0.3021 (3.3103) & 22.387224 \tabularnewline
0.3125 (3.2) & 2.67323 \tabularnewline
0.3229 (3.0968) & 5.747329 \tabularnewline
0.3333 (3) & 1.186643 \tabularnewline
0.3438 (2.9091) & 15.258207 \tabularnewline
0.3542 (2.8235) & 62.134057 \tabularnewline
0.3646 (2.7429) & 11.574101 \tabularnewline
0.375 (2.6667) & 0.537941 \tabularnewline
0.3854 (2.5946) & 47.200733 \tabularnewline
0.3958 (2.5263) & 16.260721 \tabularnewline
0.4062 (2.4615) & 2.05994 \tabularnewline
0.4167 (2.4) & 0.06644 \tabularnewline
0.4271 (2.3415) & 10.336298 \tabularnewline
0.4375 (2.2857) & 13.045738 \tabularnewline
0.4479 (2.2326) & 9.403093 \tabularnewline
0.4583 (2.1818) & 5.722208 \tabularnewline
0.4688 (2.1333) & 7.556462 \tabularnewline
0.4792 (2.087) & 8.542596 \tabularnewline
0.4896 (2.0426) & 20.984596 \tabularnewline
0.5 (2) & 0.732432 \tabularnewline
\hline
\end{tabular}
%Source: https://freestatistics.org/blog/index.php?pk=199422&T=1

[TABLE]
[ROW][C]Raw Periodogram[/C][/ROW]
[ROW][C]Parameter[/C][C]Value[/C][/ROW]
[ROW][C]Box-Cox transformation parameter (lambda)[/C][C]1[/C][/ROW]
[ROW][C]Degree of non-seasonal differencing (d)[/C][C]0[/C][/ROW]
[ROW][C]Degree of seasonal differencing (D)[/C][C]1[/C][/ROW]
[ROW][C]Seasonal Period (s)[/C][C]12[/C][/ROW]
[ROW][C]Frequency (Period)[/C][C]Spectrum[/C][/ROW]
[ROW][C]0.0104 (96)[/C][C]185.943439[/C][/ROW]
[ROW][C]0.0208 (48)[/C][C]603.65277[/C][/ROW]
[ROW][C]0.0312 (32)[/C][C]381.802434[/C][/ROW]
[ROW][C]0.0417 (24)[/C][C]139.126435[/C][/ROW]
[ROW][C]0.0521 (19.2)[/C][C]14.550443[/C][/ROW]
[ROW][C]0.0625 (16)[/C][C]53.974294[/C][/ROW]
[ROW][C]0.0729 (13.7143)[/C][C]17.719995[/C][/ROW]
[ROW][C]0.0833 (12)[/C][C]4.198612[/C][/ROW]
[ROW][C]0.0938 (10.6667)[/C][C]13.407726[/C][/ROW]
[ROW][C]0.1042 (9.6)[/C][C]16.141986[/C][/ROW]
[ROW][C]0.1146 (8.7273)[/C][C]11.928488[/C][/ROW]
[ROW][C]0.125 (8)[/C][C]13.043231[/C][/ROW]
[ROW][C]0.1354 (7.3846)[/C][C]27.296297[/C][/ROW]
[ROW][C]0.1458 (6.8571)[/C][C]9.758186[/C][/ROW]
[ROW][C]0.1562 (6.4)[/C][C]0.704475[/C][/ROW]
[ROW][C]0.1667 (6)[/C][C]3.447604[/C][/ROW]
[ROW][C]0.1771 (5.6471)[/C][C]0.926811[/C][/ROW]
[ROW][C]0.1875 (5.3333)[/C][C]0.340569[/C][/ROW]
[ROW][C]0.1979 (5.0526)[/C][C]15.125201[/C][/ROW]
[ROW][C]0.2083 (4.8)[/C][C]14.080629[/C][/ROW]
[ROW][C]0.2188 (4.5714)[/C][C]7.722524[/C][/ROW]
[ROW][C]0.2292 (4.3636)[/C][C]5.853157[/C][/ROW]
[ROW][C]0.2396 (4.1739)[/C][C]0.842526[/C][/ROW]
[ROW][C]0.25 (4)[/C][C]1.009172[/C][/ROW]
[ROW][C]0.2604 (3.84)[/C][C]1.979806[/C][/ROW]
[ROW][C]0.2708 (3.6923)[/C][C]11.943423[/C][/ROW]
[ROW][C]0.2812 (3.5556)[/C][C]17.196368[/C][/ROW]
[ROW][C]0.2917 (3.4286)[/C][C]26.872445[/C][/ROW]
[ROW][C]0.3021 (3.3103)[/C][C]22.387224[/C][/ROW]
[ROW][C]0.3125 (3.2)[/C][C]2.67323[/C][/ROW]
[ROW][C]0.3229 (3.0968)[/C][C]5.747329[/C][/ROW]
[ROW][C]0.3333 (3)[/C][C]1.186643[/C][/ROW]
[ROW][C]0.3438 (2.9091)[/C][C]15.258207[/C][/ROW]
[ROW][C]0.3542 (2.8235)[/C][C]62.134057[/C][/ROW]
[ROW][C]0.3646 (2.7429)[/C][C]11.574101[/C][/ROW]
[ROW][C]0.375 (2.6667)[/C][C]0.537941[/C][/ROW]
[ROW][C]0.3854 (2.5946)[/C][C]47.200733[/C][/ROW]
[ROW][C]0.3958 (2.5263)[/C][C]16.260721[/C][/ROW]
[ROW][C]0.4062 (2.4615)[/C][C]2.05994[/C][/ROW]
[ROW][C]0.4167 (2.4)[/C][C]0.06644[/C][/ROW]
[ROW][C]0.4271 (2.3415)[/C][C]10.336298[/C][/ROW]
[ROW][C]0.4375 (2.2857)[/C][C]13.045738[/C][/ROW]
[ROW][C]0.4479 (2.2326)[/C][C]9.403093[/C][/ROW]
[ROW][C]0.4583 (2.1818)[/C][C]5.722208[/C][/ROW]
[ROW][C]0.4688 (2.1333)[/C][C]7.556462[/C][/ROW]
[ROW][C]0.4792 (2.087)[/C][C]8.542596[/C][/ROW]
[ROW][C]0.4896 (2.0426)[/C][C]20.984596[/C][/ROW]
[ROW][C]0.5 (2)[/C][C]0.732432[/C][/ROW]
[/TABLE]
Source: https://freestatistics.org/blog/index.php?pk=199422&T=1

Globally Unique Identifier (entire table): ba.freestatistics.org/blog/index.php?pk=199422&T=1

As an alternative you can also use a QR Code:  

The GUIDs for individual cells are displayed in the table below:

Raw Periodogram
ParameterValue
Box-Cox transformation parameter (lambda)1
Degree of non-seasonal differencing (d)0
Degree of seasonal differencing (D)1
Seasonal Period (s)12
Frequency (Period)Spectrum
0.0104 (96)185.943439
0.0208 (48)603.65277
0.0312 (32)381.802434
0.0417 (24)139.126435
0.0521 (19.2)14.550443
0.0625 (16)53.974294
0.0729 (13.7143)17.719995
0.0833 (12)4.198612
0.0938 (10.6667)13.407726
0.1042 (9.6)16.141986
0.1146 (8.7273)11.928488
0.125 (8)13.043231
0.1354 (7.3846)27.296297
0.1458 (6.8571)9.758186
0.1562 (6.4)0.704475
0.1667 (6)3.447604
0.1771 (5.6471)0.926811
0.1875 (5.3333)0.340569
0.1979 (5.0526)15.125201
0.2083 (4.8)14.080629
0.2188 (4.5714)7.722524
0.2292 (4.3636)5.853157
0.2396 (4.1739)0.842526
0.25 (4)1.009172
0.2604 (3.84)1.979806
0.2708 (3.6923)11.943423
0.2812 (3.5556)17.196368
0.2917 (3.4286)26.872445
0.3021 (3.3103)22.387224
0.3125 (3.2)2.67323
0.3229 (3.0968)5.747329
0.3333 (3)1.186643
0.3438 (2.9091)15.258207
0.3542 (2.8235)62.134057
0.3646 (2.7429)11.574101
0.375 (2.6667)0.537941
0.3854 (2.5946)47.200733
0.3958 (2.5263)16.260721
0.4062 (2.4615)2.05994
0.4167 (2.4)0.06644
0.4271 (2.3415)10.336298
0.4375 (2.2857)13.045738
0.4479 (2.2326)9.403093
0.4583 (2.1818)5.722208
0.4688 (2.1333)7.556462
0.4792 (2.087)8.542596
0.4896 (2.0426)20.984596
0.5 (2)0.732432


Parameters (Session):
par1 = 12 ;
Parameters (R input):
par1 = 1 ; par2 = 2 ; par3 = 2 ; par4 = 12 ;
R code (references can be found in the software module):
par4 <- '12'
par3 <- '1'
par2 <- '0'
par1 <- '1'
par1 <- as.numeric(par1)
par2 <- as.numeric(par2)
par3 <- as.numeric(par3)
par4 <- as.numeric(par4)
if (par1 == 0) {
x <- log(x)
} else {
x <- (x ^ par1 - 1) / par1
}
if (par2 > 0) x <- diff(x,lag=1,difference=par2)
if (par3 > 0) x <- diff(x,lag=par4,difference=par3)
bitmap(file='test1.png')
r <- spectrum(x,main='Raw Periodogram')
dev.off()
bitmap(file='test2.png')
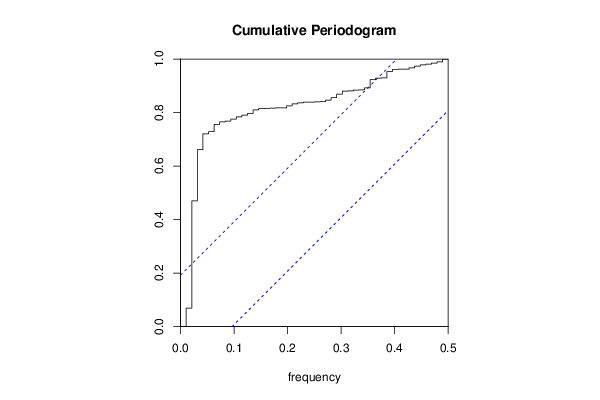
cpgram(x,main='Cumulative Periodogram')
dev.off()
load(file='createtable')
a<-table.start()
a<-table.row.start(a)
a<-table.element(a,'Raw Periodogram',2,TRUE)
a<-table.row.end(a)
a<-table.row.start(a)
a<-table.element(a,'Parameter',header=TRUE)
a<-table.element(a,'Value',header=TRUE)
a<-table.row.end(a)
a<-table.row.start(a)
a<-table.element(a,'Box-Cox transformation parameter (lambda)',header=TRUE)
a<-table.element(a,par1)
a<-table.row.end(a)
a<-table.row.start(a)
a<-table.element(a,'Degree of non-seasonal differencing (d)',header=TRUE)
a<-table.element(a,par2)
a<-table.row.end(a)
a<-table.row.start(a)
a<-table.element(a,'Degree of seasonal differencing (D)',header=TRUE)
a<-table.element(a,par3)
a<-table.row.end(a)
a<-table.row.start(a)
a<-table.element(a,'Seasonal Period (s)',header=TRUE)
a<-table.element(a,par4)
a<-table.row.end(a)
a<-table.row.start(a)
a<-table.element(a,'Frequency (Period)',header=TRUE)
a<-table.element(a,'Spectrum',header=TRUE)
a<-table.row.end(a)
for (i in 1:length(r$freq)) {
a<-table.row.start(a)
mylab <- round(r$freq[i],4)
mylab <- paste(mylab,' (',sep='')
mylab <- paste(mylab,round(1/r$freq[i],4),sep='')
mylab <- paste(mylab,')',sep='')
a<-table.element(a,mylab,header=TRUE)
a<-table.element(a,round(r$spec[i],6))
a<-table.row.end(a)
}
a<-table.end(a)
table.save(a,file='mytable.tab')