Free Statistics

of Irreproducible Research!

Author's title

Author*The author of this computation has been verified*
R Software Module--
Title produced by software(Partial) Autocorrelation Function
Date of computationThu, 13 Dec 2012 16:08:30 -0500
Cite this page as followsStatistical Computations at FreeStatistics.org, Office for Research Development and Education, URL https://freestatistics.org/blog/index.php?v=date/2012/Dec/13/t1355432934z25uvk1qkgyr95a.htm/, Retrieved Sun, 28 Apr 2024 22:24:16 +0000
Statistical Computations at FreeStatistics.org, Office for Research Development and Education, URL https://freestatistics.org/blog/index.php?pk=199420, Retrieved Sun, 28 Apr 2024 22:24:16 +0000
QR Codes:

Original text written by user:
IsPrivate?No (this computation is public)
User-defined keywords
Estimated Impact114
Family? (F = Feedback message, R = changed R code, M = changed R Module, P = changed Parameters, D = changed Data)
-     [(Partial) Autocorrelation Function] [] [2012-11-21 08:39:17] [d2c1a12335a0e7c18f8727e39be21dbc]
- RMPD  [Spectral Analysis] [Paper Spectral an...] [2012-12-13 20:30:48] [86dcce9422b96d4554cb918e531c1d5d]
- R P     [Spectral Analysis] [Paper Spectral an...] [2012-12-13 20:51:35] [86dcce9422b96d4554cb918e531c1d5d]
- RMP         [(Partial) Autocorrelation Function] [Paper Spectral an...] [2012-12-13 21:08:30] [c63d55528b56cf8bb48e0b5d1a959d8e] [Current]
Feedback Forum

Post a new message
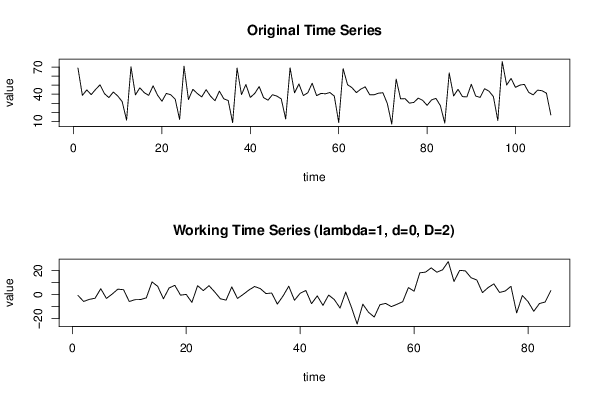
Dataseries X:
68.897
38.683
44.720
39.525
45.315
50.380
40.600
36.279
42.438
38.064
31.879
11.379
70.249
39.253
47.060
41.697
38.708
49.267
39.018
32.228
40.870
39.383
34.571
12.066
70.938
34.077
45.409
40.809
37.013
44.953
37.848
32.745
43.412
34.931
33.008
8.620
68.906
39.556
50.669
36.432
40.891
48.428
36.222
33.425
39.401
37.967
34.801
12.657
69.116
41.519
51.321
38.529
41.547
52.073
38.401
40.898
40.439
41.888
37.898
8.771
68.184
50.530
47.221
41.756
45.633
48.138
39.486
39.341
41.117
41.629
29.722
7.054
56.676
34.870
35.117
30.169
30.936
35.699
33.228
27.733
33.666
35.429
27.438
8.170
63.410
38.040
45.389
37.353
37.024
50.957
37.994
36.454
46.080
43.373
37.395
10.963
76.058
50.179
57.452
47.568
50.050
50.856
41.992
39.284
44.521
43.832
41.153
17.100


Summary of computational transaction
Raw Inputview raw input (R code)
Raw Outputview raw output of R engine
Computing time3 seconds
R Server'Sir Ronald Aylmer Fisher' @ fisher.wessa.net

\begin{tabular}{lllllllll}
\hline
Summary of computational transaction \tabularnewline
Raw Input & view raw input (R code)  \tabularnewline
Raw Output & view raw output of R engine  \tabularnewline
Computing time & 3 seconds \tabularnewline
R Server & 'Sir Ronald Aylmer Fisher' @ fisher.wessa.net \tabularnewline
\hline
\end{tabular}
%Source: https://freestatistics.org/blog/index.php?pk=199420&T=0

[TABLE]
[ROW][C]Summary of computational transaction[/C][/ROW]
[ROW][C]Raw Input[/C][C]view raw input (R code) [/C][/ROW]
[ROW][C]Raw Output[/C][C]view raw output of R engine [/C][/ROW]
[ROW][C]Computing time[/C][C]3 seconds[/C][/ROW]
[ROW][C]R Server[/C][C]'Sir Ronald Aylmer Fisher' @ fisher.wessa.net[/C][/ROW]
[/TABLE]
Source: https://freestatistics.org/blog/index.php?pk=199420&T=0

Globally Unique Identifier (entire table): ba.freestatistics.org/blog/index.php?pk=199420&T=0

As an alternative you can also use a QR Code:  

The GUIDs for individual cells are displayed in the table below:

Summary of computational transaction
Raw Inputview raw input (R code)
Raw Outputview raw output of R engine
Computing time3 seconds
R Server'Sir Ronald Aylmer Fisher' @ fisher.wessa.net


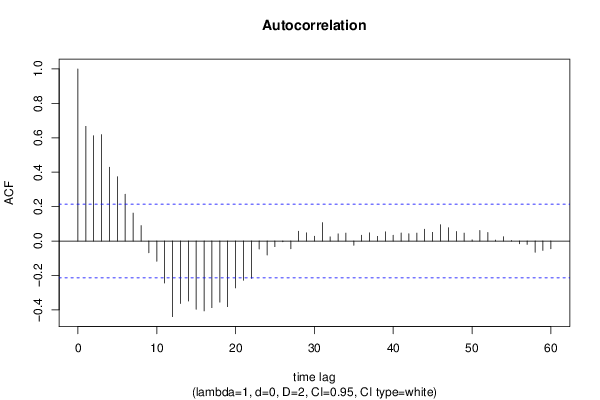
Autocorrelation Function
Time lag kACF(k)T-STATP-value
10.6664566.10820
20.6115285.60470
30.6183935.66770
40.4285863.92818.7e-05
50.3731563.420.000484
60.2721122.49390.007297
70.1622691.48720.070351
80.0892620.81810.207809
9-0.06838-0.62670.266273
10-0.117685-1.07860.141926
11-0.24462-2.2420.013799
12-0.439724-4.03016.1e-05
13-0.363511-3.33160.000642
14-0.348383-3.1930.000991
15-0.397155-3.640.000235
16-0.406151-3.72240.000178
17-0.38728-3.54950.000318
18-0.355413-3.25740.000812
19-0.381728-3.49860.000375
20-0.272647-2.49880.007204
21-0.228088-2.09050.0198
22-0.21706-1.98940.024956
23-0.046276-0.42410.33628
24-0.08138-0.74590.228917
25-0.032721-0.29990.382499
26-0.004082-0.03740.485122
27-0.044933-0.41180.34076
280.0565080.51790.302944
290.0472980.43350.332885
300.0279230.25590.39932
310.106840.97920.165144
320.024060.22050.413004
330.0414080.37950.352632
340.0459260.42090.337445
35-0.02495-0.22870.409842
360.0334870.30690.379835
370.0471830.43240.333264
380.0269870.24730.402623
390.0530860.48650.313925
400.0337060.30890.379074
410.0460590.42210.337001
420.0424910.38940.348971
430.045840.42010.337732
440.0682750.62580.266587
450.0500680.45890.323752
460.0942270.86360.195131
470.0775190.71050.23969
480.0549280.50340.307992
490.0460080.42170.337172
500.0065770.06030.47604
510.0609050.55820.289096
520.0491460.45040.326781
530.0050020.04580.481771
540.0251240.23030.409222
550.0031470.02880.488528
56-0.015969-0.14640.441994
57-0.019856-0.1820.428017
58-0.06569-0.60210.274378
59-0.054643-0.50080.308907
60-0.045407-0.41620.339177

\begin{tabular}{lllllllll}
\hline
Autocorrelation Function \tabularnewline
Time lag k & ACF(k) & T-STAT & P-value \tabularnewline
1 & 0.666456 & 6.1082 & 0 \tabularnewline
2 & 0.611528 & 5.6047 & 0 \tabularnewline
3 & 0.618393 & 5.6677 & 0 \tabularnewline
4 & 0.428586 & 3.9281 & 8.7e-05 \tabularnewline
5 & 0.373156 & 3.42 & 0.000484 \tabularnewline
6 & 0.272112 & 2.4939 & 0.007297 \tabularnewline
7 & 0.162269 & 1.4872 & 0.070351 \tabularnewline
8 & 0.089262 & 0.8181 & 0.207809 \tabularnewline
9 & -0.06838 & -0.6267 & 0.266273 \tabularnewline
10 & -0.117685 & -1.0786 & 0.141926 \tabularnewline
11 & -0.24462 & -2.242 & 0.013799 \tabularnewline
12 & -0.439724 & -4.0301 & 6.1e-05 \tabularnewline
13 & -0.363511 & -3.3316 & 0.000642 \tabularnewline
14 & -0.348383 & -3.193 & 0.000991 \tabularnewline
15 & -0.397155 & -3.64 & 0.000235 \tabularnewline
16 & -0.406151 & -3.7224 & 0.000178 \tabularnewline
17 & -0.38728 & -3.5495 & 0.000318 \tabularnewline
18 & -0.355413 & -3.2574 & 0.000812 \tabularnewline
19 & -0.381728 & -3.4986 & 0.000375 \tabularnewline
20 & -0.272647 & -2.4988 & 0.007204 \tabularnewline
21 & -0.228088 & -2.0905 & 0.0198 \tabularnewline
22 & -0.21706 & -1.9894 & 0.024956 \tabularnewline
23 & -0.046276 & -0.4241 & 0.33628 \tabularnewline
24 & -0.08138 & -0.7459 & 0.228917 \tabularnewline
25 & -0.032721 & -0.2999 & 0.382499 \tabularnewline
26 & -0.004082 & -0.0374 & 0.485122 \tabularnewline
27 & -0.044933 & -0.4118 & 0.34076 \tabularnewline
28 & 0.056508 & 0.5179 & 0.302944 \tabularnewline
29 & 0.047298 & 0.4335 & 0.332885 \tabularnewline
30 & 0.027923 & 0.2559 & 0.39932 \tabularnewline
31 & 0.10684 & 0.9792 & 0.165144 \tabularnewline
32 & 0.02406 & 0.2205 & 0.413004 \tabularnewline
33 & 0.041408 & 0.3795 & 0.352632 \tabularnewline
34 & 0.045926 & 0.4209 & 0.337445 \tabularnewline
35 & -0.02495 & -0.2287 & 0.409842 \tabularnewline
36 & 0.033487 & 0.3069 & 0.379835 \tabularnewline
37 & 0.047183 & 0.4324 & 0.333264 \tabularnewline
38 & 0.026987 & 0.2473 & 0.402623 \tabularnewline
39 & 0.053086 & 0.4865 & 0.313925 \tabularnewline
40 & 0.033706 & 0.3089 & 0.379074 \tabularnewline
41 & 0.046059 & 0.4221 & 0.337001 \tabularnewline
42 & 0.042491 & 0.3894 & 0.348971 \tabularnewline
43 & 0.04584 & 0.4201 & 0.337732 \tabularnewline
44 & 0.068275 & 0.6258 & 0.266587 \tabularnewline
45 & 0.050068 & 0.4589 & 0.323752 \tabularnewline
46 & 0.094227 & 0.8636 & 0.195131 \tabularnewline
47 & 0.077519 & 0.7105 & 0.23969 \tabularnewline
48 & 0.054928 & 0.5034 & 0.307992 \tabularnewline
49 & 0.046008 & 0.4217 & 0.337172 \tabularnewline
50 & 0.006577 & 0.0603 & 0.47604 \tabularnewline
51 & 0.060905 & 0.5582 & 0.289096 \tabularnewline
52 & 0.049146 & 0.4504 & 0.326781 \tabularnewline
53 & 0.005002 & 0.0458 & 0.481771 \tabularnewline
54 & 0.025124 & 0.2303 & 0.409222 \tabularnewline
55 & 0.003147 & 0.0288 & 0.488528 \tabularnewline
56 & -0.015969 & -0.1464 & 0.441994 \tabularnewline
57 & -0.019856 & -0.182 & 0.428017 \tabularnewline
58 & -0.06569 & -0.6021 & 0.274378 \tabularnewline
59 & -0.054643 & -0.5008 & 0.308907 \tabularnewline
60 & -0.045407 & -0.4162 & 0.339177 \tabularnewline
\hline
\end{tabular}
%Source: https://freestatistics.org/blog/index.php?pk=199420&T=1

[TABLE]
[ROW][C]Autocorrelation Function[/C][/ROW]
[ROW][C]Time lag k[/C][C]ACF(k)[/C][C]T-STAT[/C][C]P-value[/C][/ROW]
[ROW][C]1[/C][C]0.666456[/C][C]6.1082[/C][C]0[/C][/ROW]
[ROW][C]2[/C][C]0.611528[/C][C]5.6047[/C][C]0[/C][/ROW]
[ROW][C]3[/C][C]0.618393[/C][C]5.6677[/C][C]0[/C][/ROW]
[ROW][C]4[/C][C]0.428586[/C][C]3.9281[/C][C]8.7e-05[/C][/ROW]
[ROW][C]5[/C][C]0.373156[/C][C]3.42[/C][C]0.000484[/C][/ROW]
[ROW][C]6[/C][C]0.272112[/C][C]2.4939[/C][C]0.007297[/C][/ROW]
[ROW][C]7[/C][C]0.162269[/C][C]1.4872[/C][C]0.070351[/C][/ROW]
[ROW][C]8[/C][C]0.089262[/C][C]0.8181[/C][C]0.207809[/C][/ROW]
[ROW][C]9[/C][C]-0.06838[/C][C]-0.6267[/C][C]0.266273[/C][/ROW]
[ROW][C]10[/C][C]-0.117685[/C][C]-1.0786[/C][C]0.141926[/C][/ROW]
[ROW][C]11[/C][C]-0.24462[/C][C]-2.242[/C][C]0.013799[/C][/ROW]
[ROW][C]12[/C][C]-0.439724[/C][C]-4.0301[/C][C]6.1e-05[/C][/ROW]
[ROW][C]13[/C][C]-0.363511[/C][C]-3.3316[/C][C]0.000642[/C][/ROW]
[ROW][C]14[/C][C]-0.348383[/C][C]-3.193[/C][C]0.000991[/C][/ROW]
[ROW][C]15[/C][C]-0.397155[/C][C]-3.64[/C][C]0.000235[/C][/ROW]
[ROW][C]16[/C][C]-0.406151[/C][C]-3.7224[/C][C]0.000178[/C][/ROW]
[ROW][C]17[/C][C]-0.38728[/C][C]-3.5495[/C][C]0.000318[/C][/ROW]
[ROW][C]18[/C][C]-0.355413[/C][C]-3.2574[/C][C]0.000812[/C][/ROW]
[ROW][C]19[/C][C]-0.381728[/C][C]-3.4986[/C][C]0.000375[/C][/ROW]
[ROW][C]20[/C][C]-0.272647[/C][C]-2.4988[/C][C]0.007204[/C][/ROW]
[ROW][C]21[/C][C]-0.228088[/C][C]-2.0905[/C][C]0.0198[/C][/ROW]
[ROW][C]22[/C][C]-0.21706[/C][C]-1.9894[/C][C]0.024956[/C][/ROW]
[ROW][C]23[/C][C]-0.046276[/C][C]-0.4241[/C][C]0.33628[/C][/ROW]
[ROW][C]24[/C][C]-0.08138[/C][C]-0.7459[/C][C]0.228917[/C][/ROW]
[ROW][C]25[/C][C]-0.032721[/C][C]-0.2999[/C][C]0.382499[/C][/ROW]
[ROW][C]26[/C][C]-0.004082[/C][C]-0.0374[/C][C]0.485122[/C][/ROW]
[ROW][C]27[/C][C]-0.044933[/C][C]-0.4118[/C][C]0.34076[/C][/ROW]
[ROW][C]28[/C][C]0.056508[/C][C]0.5179[/C][C]0.302944[/C][/ROW]
[ROW][C]29[/C][C]0.047298[/C][C]0.4335[/C][C]0.332885[/C][/ROW]
[ROW][C]30[/C][C]0.027923[/C][C]0.2559[/C][C]0.39932[/C][/ROW]
[ROW][C]31[/C][C]0.10684[/C][C]0.9792[/C][C]0.165144[/C][/ROW]
[ROW][C]32[/C][C]0.02406[/C][C]0.2205[/C][C]0.413004[/C][/ROW]
[ROW][C]33[/C][C]0.041408[/C][C]0.3795[/C][C]0.352632[/C][/ROW]
[ROW][C]34[/C][C]0.045926[/C][C]0.4209[/C][C]0.337445[/C][/ROW]
[ROW][C]35[/C][C]-0.02495[/C][C]-0.2287[/C][C]0.409842[/C][/ROW]
[ROW][C]36[/C][C]0.033487[/C][C]0.3069[/C][C]0.379835[/C][/ROW]
[ROW][C]37[/C][C]0.047183[/C][C]0.4324[/C][C]0.333264[/C][/ROW]
[ROW][C]38[/C][C]0.026987[/C][C]0.2473[/C][C]0.402623[/C][/ROW]
[ROW][C]39[/C][C]0.053086[/C][C]0.4865[/C][C]0.313925[/C][/ROW]
[ROW][C]40[/C][C]0.033706[/C][C]0.3089[/C][C]0.379074[/C][/ROW]
[ROW][C]41[/C][C]0.046059[/C][C]0.4221[/C][C]0.337001[/C][/ROW]
[ROW][C]42[/C][C]0.042491[/C][C]0.3894[/C][C]0.348971[/C][/ROW]
[ROW][C]43[/C][C]0.04584[/C][C]0.4201[/C][C]0.337732[/C][/ROW]
[ROW][C]44[/C][C]0.068275[/C][C]0.6258[/C][C]0.266587[/C][/ROW]
[ROW][C]45[/C][C]0.050068[/C][C]0.4589[/C][C]0.323752[/C][/ROW]
[ROW][C]46[/C][C]0.094227[/C][C]0.8636[/C][C]0.195131[/C][/ROW]
[ROW][C]47[/C][C]0.077519[/C][C]0.7105[/C][C]0.23969[/C][/ROW]
[ROW][C]48[/C][C]0.054928[/C][C]0.5034[/C][C]0.307992[/C][/ROW]
[ROW][C]49[/C][C]0.046008[/C][C]0.4217[/C][C]0.337172[/C][/ROW]
[ROW][C]50[/C][C]0.006577[/C][C]0.0603[/C][C]0.47604[/C][/ROW]
[ROW][C]51[/C][C]0.060905[/C][C]0.5582[/C][C]0.289096[/C][/ROW]
[ROW][C]52[/C][C]0.049146[/C][C]0.4504[/C][C]0.326781[/C][/ROW]
[ROW][C]53[/C][C]0.005002[/C][C]0.0458[/C][C]0.481771[/C][/ROW]
[ROW][C]54[/C][C]0.025124[/C][C]0.2303[/C][C]0.409222[/C][/ROW]
[ROW][C]55[/C][C]0.003147[/C][C]0.0288[/C][C]0.488528[/C][/ROW]
[ROW][C]56[/C][C]-0.015969[/C][C]-0.1464[/C][C]0.441994[/C][/ROW]
[ROW][C]57[/C][C]-0.019856[/C][C]-0.182[/C][C]0.428017[/C][/ROW]
[ROW][C]58[/C][C]-0.06569[/C][C]-0.6021[/C][C]0.274378[/C][/ROW]
[ROW][C]59[/C][C]-0.054643[/C][C]-0.5008[/C][C]0.308907[/C][/ROW]
[ROW][C]60[/C][C]-0.045407[/C][C]-0.4162[/C][C]0.339177[/C][/ROW]
[/TABLE]
Source: https://freestatistics.org/blog/index.php?pk=199420&T=1

Globally Unique Identifier (entire table): ba.freestatistics.org/blog/index.php?pk=199420&T=1

As an alternative you can also use a QR Code:  

The GUIDs for individual cells are displayed in the table below:

Autocorrelation Function
Time lag kACF(k)T-STATP-value
10.6664566.10820
20.6115285.60470
30.6183935.66770
40.4285863.92818.7e-05
50.3731563.420.000484
60.2721122.49390.007297
70.1622691.48720.070351
80.0892620.81810.207809
9-0.06838-0.62670.266273
10-0.117685-1.07860.141926
11-0.24462-2.2420.013799
12-0.439724-4.03016.1e-05
13-0.363511-3.33160.000642
14-0.348383-3.1930.000991
15-0.397155-3.640.000235
16-0.406151-3.72240.000178
17-0.38728-3.54950.000318
18-0.355413-3.25740.000812
19-0.381728-3.49860.000375
20-0.272647-2.49880.007204
21-0.228088-2.09050.0198
22-0.21706-1.98940.024956
23-0.046276-0.42410.33628
24-0.08138-0.74590.228917
25-0.032721-0.29990.382499
26-0.004082-0.03740.485122
27-0.044933-0.41180.34076
280.0565080.51790.302944
290.0472980.43350.332885
300.0279230.25590.39932
310.106840.97920.165144
320.024060.22050.413004
330.0414080.37950.352632
340.0459260.42090.337445
35-0.02495-0.22870.409842
360.0334870.30690.379835
370.0471830.43240.333264
380.0269870.24730.402623
390.0530860.48650.313925
400.0337060.30890.379074
410.0460590.42210.337001
420.0424910.38940.348971
430.045840.42010.337732
440.0682750.62580.266587
450.0500680.45890.323752
460.0942270.86360.195131
470.0775190.71050.23969
480.0549280.50340.307992
490.0460080.42170.337172
500.0065770.06030.47604
510.0609050.55820.289096
520.0491460.45040.326781
530.0050020.04580.481771
540.0251240.23030.409222
550.0031470.02880.488528
56-0.015969-0.14640.441994
57-0.019856-0.1820.428017
58-0.06569-0.60210.274378
59-0.054643-0.50080.308907
60-0.045407-0.41620.339177


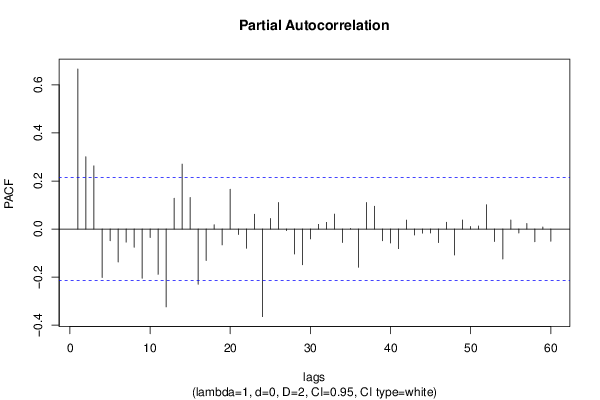
Partial Autocorrelation Function
Time lag kPACF(k)T-STATP-value
10.6664566.10820
20.3011042.75970.003551
30.26292.40950.009079
4-0.201824-1.84970.033933
5-0.04883-0.44750.327822
6-0.137502-1.26020.105539
7-0.054436-0.49890.309572
8-0.075772-0.69450.244654
9-0.204975-1.87860.031882
10-0.034954-0.32040.374745
11-0.188634-1.72890.043754
12-0.324121-2.97060.001937
130.128341.17630.121408
140.2701952.47640.007639
150.1314561.20480.11583
16-0.230059-2.10850.018982
17-0.131325-1.20360.116059
180.0179270.16430.434943
19-0.066091-0.60570.273161
200.1653461.51540.06671
21-0.022866-0.20960.417255
22-0.080321-0.73620.231843
230.0618360.56670.286201
24-0.364734-3.34280.00062
250.0439290.40260.344128
260.1102811.01070.157522
27-0.006516-0.05970.476262
28-0.103754-0.95090.172187
29-0.14842-1.36030.088688
30-0.041136-0.3770.353555
310.0193590.17740.429801
320.0276590.25350.400252
330.0622590.57060.284892
34-0.05623-0.51540.303827
350.0025970.02380.490535
36-0.158848-1.45590.074579
370.1105551.01330.156924
380.0947920.86880.193721
39-0.049145-0.45040.326785
40-0.05847-0.53590.296727
41-0.081542-0.74730.228471
420.0370790.33980.367415
43-0.024649-0.22590.410909
44-0.01709-0.15660.437955
45-0.016854-0.15450.438805
46-0.056438-0.51730.303165
470.0280470.25710.398883
48-0.107854-0.98850.162874
490.0374010.34280.366309
500.0107190.09820.460989
510.0125290.11480.454428
520.1008140.9240.179072
53-0.052234-0.47870.316686
54-0.124969-1.14540.127656
550.0373740.34250.3664
56-0.016826-0.15420.438905
570.0230460.21120.416615
58-0.052736-0.48330.315057
590.0083050.07610.469755
60-0.051189-0.46920.320086

\begin{tabular}{lllllllll}
\hline
Partial Autocorrelation Function \tabularnewline
Time lag k & PACF(k) & T-STAT & P-value \tabularnewline
1 & 0.666456 & 6.1082 & 0 \tabularnewline
2 & 0.301104 & 2.7597 & 0.003551 \tabularnewline
3 & 0.2629 & 2.4095 & 0.009079 \tabularnewline
4 & -0.201824 & -1.8497 & 0.033933 \tabularnewline
5 & -0.04883 & -0.4475 & 0.327822 \tabularnewline
6 & -0.137502 & -1.2602 & 0.105539 \tabularnewline
7 & -0.054436 & -0.4989 & 0.309572 \tabularnewline
8 & -0.075772 & -0.6945 & 0.244654 \tabularnewline
9 & -0.204975 & -1.8786 & 0.031882 \tabularnewline
10 & -0.034954 & -0.3204 & 0.374745 \tabularnewline
11 & -0.188634 & -1.7289 & 0.043754 \tabularnewline
12 & -0.324121 & -2.9706 & 0.001937 \tabularnewline
13 & 0.12834 & 1.1763 & 0.121408 \tabularnewline
14 & 0.270195 & 2.4764 & 0.007639 \tabularnewline
15 & 0.131456 & 1.2048 & 0.11583 \tabularnewline
16 & -0.230059 & -2.1085 & 0.018982 \tabularnewline
17 & -0.131325 & -1.2036 & 0.116059 \tabularnewline
18 & 0.017927 & 0.1643 & 0.434943 \tabularnewline
19 & -0.066091 & -0.6057 & 0.273161 \tabularnewline
20 & 0.165346 & 1.5154 & 0.06671 \tabularnewline
21 & -0.022866 & -0.2096 & 0.417255 \tabularnewline
22 & -0.080321 & -0.7362 & 0.231843 \tabularnewline
23 & 0.061836 & 0.5667 & 0.286201 \tabularnewline
24 & -0.364734 & -3.3428 & 0.00062 \tabularnewline
25 & 0.043929 & 0.4026 & 0.344128 \tabularnewline
26 & 0.110281 & 1.0107 & 0.157522 \tabularnewline
27 & -0.006516 & -0.0597 & 0.476262 \tabularnewline
28 & -0.103754 & -0.9509 & 0.172187 \tabularnewline
29 & -0.14842 & -1.3603 & 0.088688 \tabularnewline
30 & -0.041136 & -0.377 & 0.353555 \tabularnewline
31 & 0.019359 & 0.1774 & 0.429801 \tabularnewline
32 & 0.027659 & 0.2535 & 0.400252 \tabularnewline
33 & 0.062259 & 0.5706 & 0.284892 \tabularnewline
34 & -0.05623 & -0.5154 & 0.303827 \tabularnewline
35 & 0.002597 & 0.0238 & 0.490535 \tabularnewline
36 & -0.158848 & -1.4559 & 0.074579 \tabularnewline
37 & 0.110555 & 1.0133 & 0.156924 \tabularnewline
38 & 0.094792 & 0.8688 & 0.193721 \tabularnewline
39 & -0.049145 & -0.4504 & 0.326785 \tabularnewline
40 & -0.05847 & -0.5359 & 0.296727 \tabularnewline
41 & -0.081542 & -0.7473 & 0.228471 \tabularnewline
42 & 0.037079 & 0.3398 & 0.367415 \tabularnewline
43 & -0.024649 & -0.2259 & 0.410909 \tabularnewline
44 & -0.01709 & -0.1566 & 0.437955 \tabularnewline
45 & -0.016854 & -0.1545 & 0.438805 \tabularnewline
46 & -0.056438 & -0.5173 & 0.303165 \tabularnewline
47 & 0.028047 & 0.2571 & 0.398883 \tabularnewline
48 & -0.107854 & -0.9885 & 0.162874 \tabularnewline
49 & 0.037401 & 0.3428 & 0.366309 \tabularnewline
50 & 0.010719 & 0.0982 & 0.460989 \tabularnewline
51 & 0.012529 & 0.1148 & 0.454428 \tabularnewline
52 & 0.100814 & 0.924 & 0.179072 \tabularnewline
53 & -0.052234 & -0.4787 & 0.316686 \tabularnewline
54 & -0.124969 & -1.1454 & 0.127656 \tabularnewline
55 & 0.037374 & 0.3425 & 0.3664 \tabularnewline
56 & -0.016826 & -0.1542 & 0.438905 \tabularnewline
57 & 0.023046 & 0.2112 & 0.416615 \tabularnewline
58 & -0.052736 & -0.4833 & 0.315057 \tabularnewline
59 & 0.008305 & 0.0761 & 0.469755 \tabularnewline
60 & -0.051189 & -0.4692 & 0.320086 \tabularnewline
\hline
\end{tabular}
%Source: https://freestatistics.org/blog/index.php?pk=199420&T=2

[TABLE]
[ROW][C]Partial Autocorrelation Function[/C][/ROW]
[ROW][C]Time lag k[/C][C]PACF(k)[/C][C]T-STAT[/C][C]P-value[/C][/ROW]
[ROW][C]1[/C][C]0.666456[/C][C]6.1082[/C][C]0[/C][/ROW]
[ROW][C]2[/C][C]0.301104[/C][C]2.7597[/C][C]0.003551[/C][/ROW]
[ROW][C]3[/C][C]0.2629[/C][C]2.4095[/C][C]0.009079[/C][/ROW]
[ROW][C]4[/C][C]-0.201824[/C][C]-1.8497[/C][C]0.033933[/C][/ROW]
[ROW][C]5[/C][C]-0.04883[/C][C]-0.4475[/C][C]0.327822[/C][/ROW]
[ROW][C]6[/C][C]-0.137502[/C][C]-1.2602[/C][C]0.105539[/C][/ROW]
[ROW][C]7[/C][C]-0.054436[/C][C]-0.4989[/C][C]0.309572[/C][/ROW]
[ROW][C]8[/C][C]-0.075772[/C][C]-0.6945[/C][C]0.244654[/C][/ROW]
[ROW][C]9[/C][C]-0.204975[/C][C]-1.8786[/C][C]0.031882[/C][/ROW]
[ROW][C]10[/C][C]-0.034954[/C][C]-0.3204[/C][C]0.374745[/C][/ROW]
[ROW][C]11[/C][C]-0.188634[/C][C]-1.7289[/C][C]0.043754[/C][/ROW]
[ROW][C]12[/C][C]-0.324121[/C][C]-2.9706[/C][C]0.001937[/C][/ROW]
[ROW][C]13[/C][C]0.12834[/C][C]1.1763[/C][C]0.121408[/C][/ROW]
[ROW][C]14[/C][C]0.270195[/C][C]2.4764[/C][C]0.007639[/C][/ROW]
[ROW][C]15[/C][C]0.131456[/C][C]1.2048[/C][C]0.11583[/C][/ROW]
[ROW][C]16[/C][C]-0.230059[/C][C]-2.1085[/C][C]0.018982[/C][/ROW]
[ROW][C]17[/C][C]-0.131325[/C][C]-1.2036[/C][C]0.116059[/C][/ROW]
[ROW][C]18[/C][C]0.017927[/C][C]0.1643[/C][C]0.434943[/C][/ROW]
[ROW][C]19[/C][C]-0.066091[/C][C]-0.6057[/C][C]0.273161[/C][/ROW]
[ROW][C]20[/C][C]0.165346[/C][C]1.5154[/C][C]0.06671[/C][/ROW]
[ROW][C]21[/C][C]-0.022866[/C][C]-0.2096[/C][C]0.417255[/C][/ROW]
[ROW][C]22[/C][C]-0.080321[/C][C]-0.7362[/C][C]0.231843[/C][/ROW]
[ROW][C]23[/C][C]0.061836[/C][C]0.5667[/C][C]0.286201[/C][/ROW]
[ROW][C]24[/C][C]-0.364734[/C][C]-3.3428[/C][C]0.00062[/C][/ROW]
[ROW][C]25[/C][C]0.043929[/C][C]0.4026[/C][C]0.344128[/C][/ROW]
[ROW][C]26[/C][C]0.110281[/C][C]1.0107[/C][C]0.157522[/C][/ROW]
[ROW][C]27[/C][C]-0.006516[/C][C]-0.0597[/C][C]0.476262[/C][/ROW]
[ROW][C]28[/C][C]-0.103754[/C][C]-0.9509[/C][C]0.172187[/C][/ROW]
[ROW][C]29[/C][C]-0.14842[/C][C]-1.3603[/C][C]0.088688[/C][/ROW]
[ROW][C]30[/C][C]-0.041136[/C][C]-0.377[/C][C]0.353555[/C][/ROW]
[ROW][C]31[/C][C]0.019359[/C][C]0.1774[/C][C]0.429801[/C][/ROW]
[ROW][C]32[/C][C]0.027659[/C][C]0.2535[/C][C]0.400252[/C][/ROW]
[ROW][C]33[/C][C]0.062259[/C][C]0.5706[/C][C]0.284892[/C][/ROW]
[ROW][C]34[/C][C]-0.05623[/C][C]-0.5154[/C][C]0.303827[/C][/ROW]
[ROW][C]35[/C][C]0.002597[/C][C]0.0238[/C][C]0.490535[/C][/ROW]
[ROW][C]36[/C][C]-0.158848[/C][C]-1.4559[/C][C]0.074579[/C][/ROW]
[ROW][C]37[/C][C]0.110555[/C][C]1.0133[/C][C]0.156924[/C][/ROW]
[ROW][C]38[/C][C]0.094792[/C][C]0.8688[/C][C]0.193721[/C][/ROW]
[ROW][C]39[/C][C]-0.049145[/C][C]-0.4504[/C][C]0.326785[/C][/ROW]
[ROW][C]40[/C][C]-0.05847[/C][C]-0.5359[/C][C]0.296727[/C][/ROW]
[ROW][C]41[/C][C]-0.081542[/C][C]-0.7473[/C][C]0.228471[/C][/ROW]
[ROW][C]42[/C][C]0.037079[/C][C]0.3398[/C][C]0.367415[/C][/ROW]
[ROW][C]43[/C][C]-0.024649[/C][C]-0.2259[/C][C]0.410909[/C][/ROW]
[ROW][C]44[/C][C]-0.01709[/C][C]-0.1566[/C][C]0.437955[/C][/ROW]
[ROW][C]45[/C][C]-0.016854[/C][C]-0.1545[/C][C]0.438805[/C][/ROW]
[ROW][C]46[/C][C]-0.056438[/C][C]-0.5173[/C][C]0.303165[/C][/ROW]
[ROW][C]47[/C][C]0.028047[/C][C]0.2571[/C][C]0.398883[/C][/ROW]
[ROW][C]48[/C][C]-0.107854[/C][C]-0.9885[/C][C]0.162874[/C][/ROW]
[ROW][C]49[/C][C]0.037401[/C][C]0.3428[/C][C]0.366309[/C][/ROW]
[ROW][C]50[/C][C]0.010719[/C][C]0.0982[/C][C]0.460989[/C][/ROW]
[ROW][C]51[/C][C]0.012529[/C][C]0.1148[/C][C]0.454428[/C][/ROW]
[ROW][C]52[/C][C]0.100814[/C][C]0.924[/C][C]0.179072[/C][/ROW]
[ROW][C]53[/C][C]-0.052234[/C][C]-0.4787[/C][C]0.316686[/C][/ROW]
[ROW][C]54[/C][C]-0.124969[/C][C]-1.1454[/C][C]0.127656[/C][/ROW]
[ROW][C]55[/C][C]0.037374[/C][C]0.3425[/C][C]0.3664[/C][/ROW]
[ROW][C]56[/C][C]-0.016826[/C][C]-0.1542[/C][C]0.438905[/C][/ROW]
[ROW][C]57[/C][C]0.023046[/C][C]0.2112[/C][C]0.416615[/C][/ROW]
[ROW][C]58[/C][C]-0.052736[/C][C]-0.4833[/C][C]0.315057[/C][/ROW]
[ROW][C]59[/C][C]0.008305[/C][C]0.0761[/C][C]0.469755[/C][/ROW]
[ROW][C]60[/C][C]-0.051189[/C][C]-0.4692[/C][C]0.320086[/C][/ROW]
[/TABLE]
Source: https://freestatistics.org/blog/index.php?pk=199420&T=2

Globally Unique Identifier (entire table): ba.freestatistics.org/blog/index.php?pk=199420&T=2

As an alternative you can also use a QR Code:  

The GUIDs for individual cells are displayed in the table below:

Partial Autocorrelation Function
Time lag kPACF(k)T-STATP-value
10.6664566.10820
20.3011042.75970.003551
30.26292.40950.009079
4-0.201824-1.84970.033933
5-0.04883-0.44750.327822
6-0.137502-1.26020.105539
7-0.054436-0.49890.309572
8-0.075772-0.69450.244654
9-0.204975-1.87860.031882
10-0.034954-0.32040.374745
11-0.188634-1.72890.043754
12-0.324121-2.97060.001937
130.128341.17630.121408
140.2701952.47640.007639
150.1314561.20480.11583
16-0.230059-2.10850.018982
17-0.131325-1.20360.116059
180.0179270.16430.434943
19-0.066091-0.60570.273161
200.1653461.51540.06671
21-0.022866-0.20960.417255
22-0.080321-0.73620.231843
230.0618360.56670.286201
24-0.364734-3.34280.00062
250.0439290.40260.344128
260.1102811.01070.157522
27-0.006516-0.05970.476262
28-0.103754-0.95090.172187
29-0.14842-1.36030.088688
30-0.041136-0.3770.353555
310.0193590.17740.429801
320.0276590.25350.400252
330.0622590.57060.284892
34-0.05623-0.51540.303827
350.0025970.02380.490535
36-0.158848-1.45590.074579
370.1105551.01330.156924
380.0947920.86880.193721
39-0.049145-0.45040.326785
40-0.05847-0.53590.296727
41-0.081542-0.74730.228471
420.0370790.33980.367415
43-0.024649-0.22590.410909
44-0.01709-0.15660.437955
45-0.016854-0.15450.438805
46-0.056438-0.51730.303165
470.0280470.25710.398883
48-0.107854-0.98850.162874
490.0374010.34280.366309
500.0107190.09820.460989
510.0125290.11480.454428
520.1008140.9240.179072
53-0.052234-0.47870.316686
54-0.124969-1.14540.127656
550.0373740.34250.3664
56-0.016826-0.15420.438905
570.0230460.21120.416615
58-0.052736-0.48330.315057
590.0083050.07610.469755
60-0.051189-0.46920.320086


Parameters (Session):
par1 = 1 ; par2 = 2 ; par3 = 2 ; par4 = 12 ;
Parameters (R input):
par1 = 48 ; par2 = 1 ; par3 = 0 ; par4 = 2 ; par5 = 12 ; par6 = White Noise ; par7 = 0.95 ; par8 = ; par9 = ; par10 = ; par11 = ; par12 = ; par13 = ; par14 = ; par15 = ; par16 = ; par17 = ; par18 = ; par19 = ; par20 = ;
R code (references can be found in the software module):
par8 <- ''
par7 <- '0.95'
par6 <- 'White Noise'
par5 <- '12'
par4 <- '2'
par3 <- '0'
par2 <- '1'
par1 <- '60'
if (par1 == 'Default') {
par1 = 10*log10(length(x))
} else {
par1 <- as.numeric(par1)
}
par2 <- as.numeric(par2)
par3 <- as.numeric(par3)
par4 <- as.numeric(par4)
par5 <- as.numeric(par5)
if (par6 == 'White Noise') par6 <- 'white' else par6 <- 'ma'
par7 <- as.numeric(par7)
if (par8 != '') par8 <- as.numeric(par8)
ox <- x
if (par8 == '') {
if (par2 == 0) {
x <- log(x)
} else {
x <- (x ^ par2 - 1) / par2
}
} else {
x <- log(x,base=par8)
}
if (par3 > 0) x <- diff(x,lag=1,difference=par3)
if (par4 > 0) x <- diff(x,lag=par5,difference=par4)
bitmap(file='picts.png')
op <- par(mfrow=c(2,1))
plot(ox,type='l',main='Original Time Series',xlab='time',ylab='value')
if (par8=='') {
mytitle <- paste('Working Time Series (lambda=',par2,', d=',par3,', D=',par4,')',sep='')
mysub <- paste('(lambda=',par2,', d=',par3,', D=',par4,', CI=', par7, ', CI type=',par6,')',sep='')
} else {
mytitle <- paste('Working Time Series (base=',par8,', d=',par3,', D=',par4,')',sep='')
mysub <- paste('(base=',par8,', d=',par3,', D=',par4,', CI=', par7, ', CI type=',par6,')',sep='')
}
plot(x,type='l', main=mytitle,xlab='time',ylab='value')
par(op)
dev.off()
bitmap(file='pic1.png')
racf <- acf(x, par1, main='Autocorrelation', xlab='time lag', ylab='ACF', ci.type=par6, ci=par7, sub=mysub)
dev.off()
bitmap(file='pic2.png')
rpacf <- pacf(x,par1,main='Partial Autocorrelation',xlab='lags',ylab='PACF',sub=mysub)
dev.off()
(myacf <- c(racf$acf))
(mypacf <- c(rpacf$acf))
lengthx <- length(x)
sqrtn <- sqrt(lengthx)
load(file='createtable')
a<-table.start()
a<-table.row.start(a)
a<-table.element(a,'Autocorrelation Function',4,TRUE)
a<-table.row.end(a)
a<-table.row.start(a)
a<-table.element(a,'Time lag k',header=TRUE)
a<-table.element(a,hyperlink('basics.htm','ACF(k)','click here for more information about the Autocorrelation Function'),header=TRUE)
a<-table.element(a,'T-STAT',header=TRUE)
a<-table.element(a,'P-value',header=TRUE)
a<-table.row.end(a)
for (i in 2:(par1+1)) {
a<-table.row.start(a)
a<-table.element(a,i-1,header=TRUE)
a<-table.element(a,round(myacf[i],6))
mytstat <- myacf[i]*sqrtn
a<-table.element(a,round(mytstat,4))
a<-table.element(a,round(1-pt(abs(mytstat),lengthx),6))
a<-table.row.end(a)
}
a<-table.end(a)
table.save(a,file='mytable.tab')
a<-table.start()
a<-table.row.start(a)
a<-table.element(a,'Partial Autocorrelation Function',4,TRUE)
a<-table.row.end(a)
a<-table.row.start(a)
a<-table.element(a,'Time lag k',header=TRUE)
a<-table.element(a,hyperlink('basics.htm','PACF(k)','click here for more information about the Partial Autocorrelation Function'),header=TRUE)
a<-table.element(a,'T-STAT',header=TRUE)
a<-table.element(a,'P-value',header=TRUE)
a<-table.row.end(a)
for (i in 1:par1) {
a<-table.row.start(a)
a<-table.element(a,i,header=TRUE)
a<-table.element(a,round(mypacf[i],6))
mytstat <- mypacf[i]*sqrtn
a<-table.element(a,round(mytstat,4))
a<-table.element(a,round(1-pt(abs(mytstat),lengthx),6))
a<-table.row.end(a)
}
a<-table.end(a)
table.save(a,file='mytable1.tab')