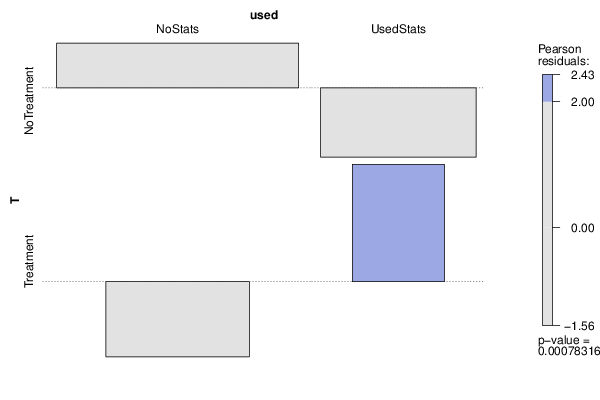
| Tabulation of Results | ||
| T x used | ||
| NoStats | UsedStats | NoTreatment | 89 | 25 | Treatment | 20 | 20 |
| Tabulation of Expected Results | ||
| T x used | ||
| NoStats | UsedStats | NoTreatment | 80.69 | 33.31 | Treatment | 28.31 | 11.69 |
| Statistical Results | |
| Pearson's Chi-squared test with simulated p-value (based on 2000 replicates) | |
| Exact Pearson Chi Square Statistic | 11.28 |
| P value | 0 |