Free Statistics

of Irreproducible Research!

Author's title

Author*The author of this computation has been verified*
R Software Modulerwasp_multipleregression.wasp
Title produced by softwareMultiple Regression
Date of computationThu, 13 Dec 2012 13:30:29 -0500
Cite this page as followsStatistical Computations at FreeStatistics.org, Office for Research Development and Education, URL https://freestatistics.org/blog/index.php?v=date/2012/Dec/13/t1355423486o9brwdkmw3398w2.htm/, Retrieved Sun, 28 Apr 2024 23:21:23 +0000
Statistical Computations at FreeStatistics.org, Office for Research Development and Education, URL https://freestatistics.org/blog/index.php?pk=199353, Retrieved Sun, 28 Apr 2024 23:21:23 +0000
QR Codes:

Original text written by user:
IsPrivate?No (this computation is public)
User-defined keywords
Estimated Impact85
Family? (F = Feedback message, R = changed R code, M = changed R Module, P = changed Parameters, D = changed Data)
-       [Multiple Regression] [Paper deel 4 Mult...] [2012-12-13 18:30:29] [46cc0db4bd6f6541b375e62191991224] [Current]
Feedback Forum

Post a new message
Dataseries X:
1,472
1,475
1,553
1,575
1,556
1,555
1,577
1,498
1,437
1,332
1,273
1,345
1,324
1,279
1,305
1,319
1,365
1,402
1,409
1,427
1,456
1,482
1,491
1,461
1,427
1,369
1,357
1,341
1,257
1,221
1,277
1,289
1,307
1,390
1,366
1,322
1,336
1,365
1,400
1,444
1,435
1,439
1,426
1,434
1,377
1,371
1,356
1,318
1,291
1,322
1,320
1,316
1,279
1,253
1,229
1,240
1,286
1,297
1,283


Summary of computational transaction
Raw Inputview raw input (R code)
Raw Outputview raw output of R engine
Computing time9 seconds
R Server'Herman Ole Andreas Wold' @ wold.wessa.net

\begin{tabular}{lllllllll}
\hline
Summary of computational transaction \tabularnewline
Raw Input & view raw input (R code)  \tabularnewline
Raw Output & view raw output of R engine  \tabularnewline
Computing time & 9 seconds \tabularnewline
R Server & 'Herman Ole Andreas Wold' @ wold.wessa.net \tabularnewline
\hline
\end{tabular}
%Source: https://freestatistics.org/blog/index.php?pk=199353&T=0

[TABLE]
[ROW][C]Summary of computational transaction[/C][/ROW]
[ROW][C]Raw Input[/C][C]view raw input (R code) [/C][/ROW]
[ROW][C]Raw Output[/C][C]view raw output of R engine [/C][/ROW]
[ROW][C]Computing time[/C][C]9 seconds[/C][/ROW]
[ROW][C]R Server[/C][C]'Herman Ole Andreas Wold' @ wold.wessa.net[/C][/ROW]
[/TABLE]
Source: https://freestatistics.org/blog/index.php?pk=199353&T=0

Globally Unique Identifier (entire table): ba.freestatistics.org/blog/index.php?pk=199353&T=0

As an alternative you can also use a QR Code:  

The GUIDs for individual cells are displayed in the table below:

Summary of computational transaction
Raw Inputview raw input (R code)
Raw Outputview raw output of R engine
Computing time9 seconds
R Server'Herman Ole Andreas Wold' @ wold.wessa.net


Multiple Linear Regression - Estimated Regression Equation
Dollar[t] = + 1.3615 + 0.00849999999999968M1[t] + 0.000499999999999861M2[t] + 0.0254999999999998M3[t] + 0.0374999999999998M4[t] + 0.0168999999999998M5[t] + 0.0124999999999998M6[t] + 0.0220999999999998M7[t] + 0.0160999999999998M8[t] + 0.0110999999999998M9[t] + 0.0128999999999998M10[t] -0.00770000000000014M11[t] + e[t]

\begin{tabular}{lllllllll}
\hline
Multiple Linear Regression - Estimated Regression Equation \tabularnewline
Dollar[t] =  +  1.3615 +  0.00849999999999968M1[t] +  0.000499999999999861M2[t] +  0.0254999999999998M3[t] +  0.0374999999999998M4[t] +  0.0168999999999998M5[t] +  0.0124999999999998M6[t] +  0.0220999999999998M7[t] +  0.0160999999999998M8[t] +  0.0110999999999998M9[t] +  0.0128999999999998M10[t] -0.00770000000000014M11[t]  + e[t] \tabularnewline
\hline
\end{tabular}
%Source: https://freestatistics.org/blog/index.php?pk=199353&T=1

[TABLE]
[ROW][C]Multiple Linear Regression - Estimated Regression Equation[/C][/ROW]
[ROW][C]Dollar[t] =  +  1.3615 +  0.00849999999999968M1[t] +  0.000499999999999861M2[t] +  0.0254999999999998M3[t] +  0.0374999999999998M4[t] +  0.0168999999999998M5[t] +  0.0124999999999998M6[t] +  0.0220999999999998M7[t] +  0.0160999999999998M8[t] +  0.0110999999999998M9[t] +  0.0128999999999998M10[t] -0.00770000000000014M11[t]  + e[t][/C][/ROW]
[/TABLE]
Source: https://freestatistics.org/blog/index.php?pk=199353&T=1

Globally Unique Identifier (entire table): ba.freestatistics.org/blog/index.php?pk=199353&T=1

As an alternative you can also use a QR Code:  

The GUIDs for individual cells are displayed in the table below:

Multiple Linear Regression - Estimated Regression Equation
Dollar[t] = + 1.3615 + 0.00849999999999968M1[t] + 0.000499999999999861M2[t] + 0.0254999999999998M3[t] + 0.0374999999999998M4[t] + 0.0168999999999998M5[t] + 0.0124999999999998M6[t] + 0.0220999999999998M7[t] + 0.0160999999999998M8[t] + 0.0110999999999998M9[t] + 0.0128999999999998M10[t] -0.00770000000000014M11[t] + e[t]


Multiple Linear Regression - Ordinary Least Squares
VariableParameterS.D.T-STATH0: parameter = 02-tail p-value1-tail p-value
(Intercept)1.36150.0504262700
M10.008499999999999680.0676530.12560.9005520.450276
M20.0004999999999998610.0676530.00740.9941340.497067
M30.02549999999999980.0676530.37690.7079280.353964
M40.03749999999999980.0676530.55430.5820040.291002
M50.01689999999999980.0676530.24980.8038280.401914
M60.01249999999999980.0676530.18480.8542080.427104
M70.02209999999999980.0676530.32670.7453710.372686
M80.01609999999999980.0676530.2380.8129330.406466
M90.01109999999999980.0676530.16410.8703780.435189
M100.01289999999999980.0676530.19070.8495990.4248
M11-0.007700000000000140.067653-0.11380.9098690.454934

\begin{tabular}{lllllllll}
\hline
Multiple Linear Regression - Ordinary Least Squares \tabularnewline
Variable & Parameter & S.D. & T-STATH0: parameter = 0 & 2-tail p-value & 1-tail p-value \tabularnewline
(Intercept) & 1.3615 & 0.050426 & 27 & 0 & 0 \tabularnewline
M1 & 0.00849999999999968 & 0.067653 & 0.1256 & 0.900552 & 0.450276 \tabularnewline
M2 & 0.000499999999999861 & 0.067653 & 0.0074 & 0.994134 & 0.497067 \tabularnewline
M3 & 0.0254999999999998 & 0.067653 & 0.3769 & 0.707928 & 0.353964 \tabularnewline
M4 & 0.0374999999999998 & 0.067653 & 0.5543 & 0.582004 & 0.291002 \tabularnewline
M5 & 0.0168999999999998 & 0.067653 & 0.2498 & 0.803828 & 0.401914 \tabularnewline
M6 & 0.0124999999999998 & 0.067653 & 0.1848 & 0.854208 & 0.427104 \tabularnewline
M7 & 0.0220999999999998 & 0.067653 & 0.3267 & 0.745371 & 0.372686 \tabularnewline
M8 & 0.0160999999999998 & 0.067653 & 0.238 & 0.812933 & 0.406466 \tabularnewline
M9 & 0.0110999999999998 & 0.067653 & 0.1641 & 0.870378 & 0.435189 \tabularnewline
M10 & 0.0128999999999998 & 0.067653 & 0.1907 & 0.849599 & 0.4248 \tabularnewline
M11 & -0.00770000000000014 & 0.067653 & -0.1138 & 0.909869 & 0.454934 \tabularnewline
\hline
\end{tabular}
%Source: https://freestatistics.org/blog/index.php?pk=199353&T=2

[TABLE]
[ROW][C]Multiple Linear Regression - Ordinary Least Squares[/C][/ROW]
[ROW][C]Variable[/C][C]Parameter[/C][C]S.D.[/C][C]T-STATH0: parameter = 0[/C][C]2-tail p-value[/C][C]1-tail p-value[/C][/ROW]
[ROW][C](Intercept)[/C][C]1.3615[/C][C]0.050426[/C][C]27[/C][C]0[/C][C]0[/C][/ROW]
[ROW][C]M1[/C][C]0.00849999999999968[/C][C]0.067653[/C][C]0.1256[/C][C]0.900552[/C][C]0.450276[/C][/ROW]
[ROW][C]M2[/C][C]0.000499999999999861[/C][C]0.067653[/C][C]0.0074[/C][C]0.994134[/C][C]0.497067[/C][/ROW]
[ROW][C]M3[/C][C]0.0254999999999998[/C][C]0.067653[/C][C]0.3769[/C][C]0.707928[/C][C]0.353964[/C][/ROW]
[ROW][C]M4[/C][C]0.0374999999999998[/C][C]0.067653[/C][C]0.5543[/C][C]0.582004[/C][C]0.291002[/C][/ROW]
[ROW][C]M5[/C][C]0.0168999999999998[/C][C]0.067653[/C][C]0.2498[/C][C]0.803828[/C][C]0.401914[/C][/ROW]
[ROW][C]M6[/C][C]0.0124999999999998[/C][C]0.067653[/C][C]0.1848[/C][C]0.854208[/C][C]0.427104[/C][/ROW]
[ROW][C]M7[/C][C]0.0220999999999998[/C][C]0.067653[/C][C]0.3267[/C][C]0.745371[/C][C]0.372686[/C][/ROW]
[ROW][C]M8[/C][C]0.0160999999999998[/C][C]0.067653[/C][C]0.238[/C][C]0.812933[/C][C]0.406466[/C][/ROW]
[ROW][C]M9[/C][C]0.0110999999999998[/C][C]0.067653[/C][C]0.1641[/C][C]0.870378[/C][C]0.435189[/C][/ROW]
[ROW][C]M10[/C][C]0.0128999999999998[/C][C]0.067653[/C][C]0.1907[/C][C]0.849599[/C][C]0.4248[/C][/ROW]
[ROW][C]M11[/C][C]-0.00770000000000014[/C][C]0.067653[/C][C]-0.1138[/C][C]0.909869[/C][C]0.454934[/C][/ROW]
[/TABLE]
Source: https://freestatistics.org/blog/index.php?pk=199353&T=2

Globally Unique Identifier (entire table): ba.freestatistics.org/blog/index.php?pk=199353&T=2

As an alternative you can also use a QR Code:  

The GUIDs for individual cells are displayed in the table below:

Multiple Linear Regression - Ordinary Least Squares
VariableParameterS.D.T-STATH0: parameter = 02-tail p-value1-tail p-value
(Intercept)1.36150.0504262700
M10.008499999999999680.0676530.12560.9005520.450276
M20.0004999999999998610.0676530.00740.9941340.497067
M30.02549999999999980.0676530.37690.7079280.353964
M40.03749999999999980.0676530.55430.5820040.291002
M50.01689999999999980.0676530.24980.8038280.401914
M60.01249999999999980.0676530.18480.8542080.427104
M70.02209999999999980.0676530.32670.7453710.372686
M80.01609999999999980.0676530.2380.8129330.406466
M90.01109999999999980.0676530.16410.8703780.435189
M100.01289999999999980.0676530.19070.8495990.4248
M11-0.007700000000000140.067653-0.11380.9098690.454934


Multiple Linear Regression - Regression Statistics
Multiple R0.128596492431053
R-squared0.01653705786557
Adjusted R-squared-0.213635120080786
F-TEST (value)0.0718464673407405
F-TEST (DF numerator)11
F-TEST (DF denominator)47
p-value0.999977091596499
Multiple Linear Regression - Residual Statistics
Residual Standard Deviation0.100851671153571
Sum Squared Residuals0.4780398

\begin{tabular}{lllllllll}
\hline
Multiple Linear Regression - Regression Statistics \tabularnewline
Multiple R & 0.128596492431053 \tabularnewline
R-squared & 0.01653705786557 \tabularnewline
Adjusted R-squared & -0.213635120080786 \tabularnewline
F-TEST (value) & 0.0718464673407405 \tabularnewline
F-TEST (DF numerator) & 11 \tabularnewline
F-TEST (DF denominator) & 47 \tabularnewline
p-value & 0.999977091596499 \tabularnewline
Multiple Linear Regression - Residual Statistics \tabularnewline
Residual Standard Deviation & 0.100851671153571 \tabularnewline
Sum Squared Residuals & 0.4780398 \tabularnewline
\hline
\end{tabular}
%Source: https://freestatistics.org/blog/index.php?pk=199353&T=3

[TABLE]
[ROW][C]Multiple Linear Regression - Regression Statistics[/C][/ROW]
[ROW][C]Multiple R[/C][C]0.128596492431053[/C][/ROW]
[ROW][C]R-squared[/C][C]0.01653705786557[/C][/ROW]
[ROW][C]Adjusted R-squared[/C][C]-0.213635120080786[/C][/ROW]
[ROW][C]F-TEST (value)[/C][C]0.0718464673407405[/C][/ROW]
[ROW][C]F-TEST (DF numerator)[/C][C]11[/C][/ROW]
[ROW][C]F-TEST (DF denominator)[/C][C]47[/C][/ROW]
[ROW][C]p-value[/C][C]0.999977091596499[/C][/ROW]
[ROW][C]Multiple Linear Regression - Residual Statistics[/C][/ROW]
[ROW][C]Residual Standard Deviation[/C][C]0.100851671153571[/C][/ROW]
[ROW][C]Sum Squared Residuals[/C][C]0.4780398[/C][/ROW]
[/TABLE]
Source: https://freestatistics.org/blog/index.php?pk=199353&T=3

Globally Unique Identifier (entire table): ba.freestatistics.org/blog/index.php?pk=199353&T=3

As an alternative you can also use a QR Code:  

The GUIDs for individual cells are displayed in the table below:

Multiple Linear Regression - Regression Statistics
Multiple R0.128596492431053
R-squared0.01653705786557
Adjusted R-squared-0.213635120080786
F-TEST (value)0.0718464673407405
F-TEST (DF numerator)11
F-TEST (DF denominator)47
p-value0.999977091596499
Multiple Linear Regression - Residual Statistics
Residual Standard Deviation0.100851671153571
Sum Squared Residuals0.4780398


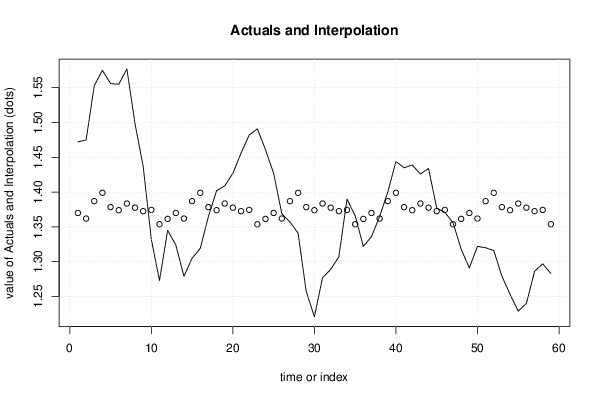
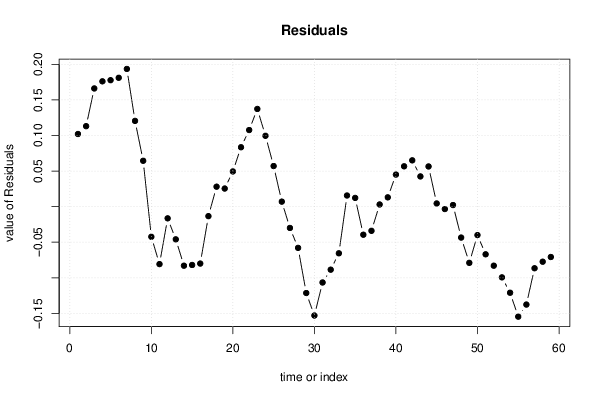
Multiple Linear Regression - Actuals, Interpolation, and Residuals
Time or IndexActualsInterpolationForecastResidualsPrediction Error
11.4721.370.101999999999999
21.4751.3620.113
31.5531.3870.166
41.5751.3990.176
51.5561.37840.1776
61.5551.3740.181
71.5771.38360.1934
81.4981.37760.1204
91.4371.37260.0644000000000001
101.3321.3744-0.0423999999999999
111.2731.3538-0.0808000000000001
121.3451.3615-0.0165000000000001
131.3241.37-0.0459999999999998
141.2791.362-0.0830000000000001
151.3051.387-0.082
161.3191.399-0.08
171.3651.3784-0.0134
181.4021.3740.0279999999999999
191.4091.38360.0254000000000001
201.4271.37760.0494000000000001
211.4561.37260.0834
221.4821.37440.1076
231.4911.35380.1372
241.4611.36150.0994999999999999
251.4271.370.0570000000000002
261.3691.3620.00699999999999999
271.3571.387-0.03
281.3411.399-0.058
291.2571.3784-0.1214
301.2211.374-0.153
311.2771.3836-0.1066
321.2891.3776-0.0886000000000001
331.3071.3726-0.0656
341.391.37440.0155999999999999
351.3661.35380.0122000000000001
361.3221.3615-0.0395000000000001
371.3361.37-0.0339999999999997
381.3651.3620.00299999999999999
391.41.3870.0129999999999999
401.4441.3990.045
411.4351.37840.0566000000000001
421.4391.3740.0650000000000001
431.4261.38360.0424
441.4341.37760.0564
451.3771.37260.00440000000000004
461.3711.3744-0.00339999999999993
471.3561.35380.00220000000000009
481.3181.3615-0.0435000000000001
491.2911.37-0.0789999999999999
501.3221.362-0.04
511.321.387-0.0669999999999999
521.3161.399-0.0829999999999999
531.2791.3784-0.0994000000000001
541.2531.374-0.121
551.2291.3836-0.1546
561.241.3776-0.1376
571.2861.3726-0.0866
581.2971.3744-0.0774
591.2831.3538-0.0708000000000001

\begin{tabular}{lllllllll}
\hline
Multiple Linear Regression - Actuals, Interpolation, and Residuals \tabularnewline
Time or Index & Actuals & InterpolationForecast & ResidualsPrediction Error \tabularnewline
1 & 1.472 & 1.37 & 0.101999999999999 \tabularnewline
2 & 1.475 & 1.362 & 0.113 \tabularnewline
3 & 1.553 & 1.387 & 0.166 \tabularnewline
4 & 1.575 & 1.399 & 0.176 \tabularnewline
5 & 1.556 & 1.3784 & 0.1776 \tabularnewline
6 & 1.555 & 1.374 & 0.181 \tabularnewline
7 & 1.577 & 1.3836 & 0.1934 \tabularnewline
8 & 1.498 & 1.3776 & 0.1204 \tabularnewline
9 & 1.437 & 1.3726 & 0.0644000000000001 \tabularnewline
10 & 1.332 & 1.3744 & -0.0423999999999999 \tabularnewline
11 & 1.273 & 1.3538 & -0.0808000000000001 \tabularnewline
12 & 1.345 & 1.3615 & -0.0165000000000001 \tabularnewline
13 & 1.324 & 1.37 & -0.0459999999999998 \tabularnewline
14 & 1.279 & 1.362 & -0.0830000000000001 \tabularnewline
15 & 1.305 & 1.387 & -0.082 \tabularnewline
16 & 1.319 & 1.399 & -0.08 \tabularnewline
17 & 1.365 & 1.3784 & -0.0134 \tabularnewline
18 & 1.402 & 1.374 & 0.0279999999999999 \tabularnewline
19 & 1.409 & 1.3836 & 0.0254000000000001 \tabularnewline
20 & 1.427 & 1.3776 & 0.0494000000000001 \tabularnewline
21 & 1.456 & 1.3726 & 0.0834 \tabularnewline
22 & 1.482 & 1.3744 & 0.1076 \tabularnewline
23 & 1.491 & 1.3538 & 0.1372 \tabularnewline
24 & 1.461 & 1.3615 & 0.0994999999999999 \tabularnewline
25 & 1.427 & 1.37 & 0.0570000000000002 \tabularnewline
26 & 1.369 & 1.362 & 0.00699999999999999 \tabularnewline
27 & 1.357 & 1.387 & -0.03 \tabularnewline
28 & 1.341 & 1.399 & -0.058 \tabularnewline
29 & 1.257 & 1.3784 & -0.1214 \tabularnewline
30 & 1.221 & 1.374 & -0.153 \tabularnewline
31 & 1.277 & 1.3836 & -0.1066 \tabularnewline
32 & 1.289 & 1.3776 & -0.0886000000000001 \tabularnewline
33 & 1.307 & 1.3726 & -0.0656 \tabularnewline
34 & 1.39 & 1.3744 & 0.0155999999999999 \tabularnewline
35 & 1.366 & 1.3538 & 0.0122000000000001 \tabularnewline
36 & 1.322 & 1.3615 & -0.0395000000000001 \tabularnewline
37 & 1.336 & 1.37 & -0.0339999999999997 \tabularnewline
38 & 1.365 & 1.362 & 0.00299999999999999 \tabularnewline
39 & 1.4 & 1.387 & 0.0129999999999999 \tabularnewline
40 & 1.444 & 1.399 & 0.045 \tabularnewline
41 & 1.435 & 1.3784 & 0.0566000000000001 \tabularnewline
42 & 1.439 & 1.374 & 0.0650000000000001 \tabularnewline
43 & 1.426 & 1.3836 & 0.0424 \tabularnewline
44 & 1.434 & 1.3776 & 0.0564 \tabularnewline
45 & 1.377 & 1.3726 & 0.00440000000000004 \tabularnewline
46 & 1.371 & 1.3744 & -0.00339999999999993 \tabularnewline
47 & 1.356 & 1.3538 & 0.00220000000000009 \tabularnewline
48 & 1.318 & 1.3615 & -0.0435000000000001 \tabularnewline
49 & 1.291 & 1.37 & -0.0789999999999999 \tabularnewline
50 & 1.322 & 1.362 & -0.04 \tabularnewline
51 & 1.32 & 1.387 & -0.0669999999999999 \tabularnewline
52 & 1.316 & 1.399 & -0.0829999999999999 \tabularnewline
53 & 1.279 & 1.3784 & -0.0994000000000001 \tabularnewline
54 & 1.253 & 1.374 & -0.121 \tabularnewline
55 & 1.229 & 1.3836 & -0.1546 \tabularnewline
56 & 1.24 & 1.3776 & -0.1376 \tabularnewline
57 & 1.286 & 1.3726 & -0.0866 \tabularnewline
58 & 1.297 & 1.3744 & -0.0774 \tabularnewline
59 & 1.283 & 1.3538 & -0.0708000000000001 \tabularnewline
\hline
\end{tabular}
%Source: https://freestatistics.org/blog/index.php?pk=199353&T=4

[TABLE]
[ROW][C]Multiple Linear Regression - Actuals, Interpolation, and Residuals[/C][/ROW]
[ROW][C]Time or Index[/C][C]Actuals[/C][C]InterpolationForecast[/C][C]ResidualsPrediction Error[/C][/ROW]
[ROW][C]1[/C][C]1.472[/C][C]1.37[/C][C]0.101999999999999[/C][/ROW]
[ROW][C]2[/C][C]1.475[/C][C]1.362[/C][C]0.113[/C][/ROW]
[ROW][C]3[/C][C]1.553[/C][C]1.387[/C][C]0.166[/C][/ROW]
[ROW][C]4[/C][C]1.575[/C][C]1.399[/C][C]0.176[/C][/ROW]
[ROW][C]5[/C][C]1.556[/C][C]1.3784[/C][C]0.1776[/C][/ROW]
[ROW][C]6[/C][C]1.555[/C][C]1.374[/C][C]0.181[/C][/ROW]
[ROW][C]7[/C][C]1.577[/C][C]1.3836[/C][C]0.1934[/C][/ROW]
[ROW][C]8[/C][C]1.498[/C][C]1.3776[/C][C]0.1204[/C][/ROW]
[ROW][C]9[/C][C]1.437[/C][C]1.3726[/C][C]0.0644000000000001[/C][/ROW]
[ROW][C]10[/C][C]1.332[/C][C]1.3744[/C][C]-0.0423999999999999[/C][/ROW]
[ROW][C]11[/C][C]1.273[/C][C]1.3538[/C][C]-0.0808000000000001[/C][/ROW]
[ROW][C]12[/C][C]1.345[/C][C]1.3615[/C][C]-0.0165000000000001[/C][/ROW]
[ROW][C]13[/C][C]1.324[/C][C]1.37[/C][C]-0.0459999999999998[/C][/ROW]
[ROW][C]14[/C][C]1.279[/C][C]1.362[/C][C]-0.0830000000000001[/C][/ROW]
[ROW][C]15[/C][C]1.305[/C][C]1.387[/C][C]-0.082[/C][/ROW]
[ROW][C]16[/C][C]1.319[/C][C]1.399[/C][C]-0.08[/C][/ROW]
[ROW][C]17[/C][C]1.365[/C][C]1.3784[/C][C]-0.0134[/C][/ROW]
[ROW][C]18[/C][C]1.402[/C][C]1.374[/C][C]0.0279999999999999[/C][/ROW]
[ROW][C]19[/C][C]1.409[/C][C]1.3836[/C][C]0.0254000000000001[/C][/ROW]
[ROW][C]20[/C][C]1.427[/C][C]1.3776[/C][C]0.0494000000000001[/C][/ROW]
[ROW][C]21[/C][C]1.456[/C][C]1.3726[/C][C]0.0834[/C][/ROW]
[ROW][C]22[/C][C]1.482[/C][C]1.3744[/C][C]0.1076[/C][/ROW]
[ROW][C]23[/C][C]1.491[/C][C]1.3538[/C][C]0.1372[/C][/ROW]
[ROW][C]24[/C][C]1.461[/C][C]1.3615[/C][C]0.0994999999999999[/C][/ROW]
[ROW][C]25[/C][C]1.427[/C][C]1.37[/C][C]0.0570000000000002[/C][/ROW]
[ROW][C]26[/C][C]1.369[/C][C]1.362[/C][C]0.00699999999999999[/C][/ROW]
[ROW][C]27[/C][C]1.357[/C][C]1.387[/C][C]-0.03[/C][/ROW]
[ROW][C]28[/C][C]1.341[/C][C]1.399[/C][C]-0.058[/C][/ROW]
[ROW][C]29[/C][C]1.257[/C][C]1.3784[/C][C]-0.1214[/C][/ROW]
[ROW][C]30[/C][C]1.221[/C][C]1.374[/C][C]-0.153[/C][/ROW]
[ROW][C]31[/C][C]1.277[/C][C]1.3836[/C][C]-0.1066[/C][/ROW]
[ROW][C]32[/C][C]1.289[/C][C]1.3776[/C][C]-0.0886000000000001[/C][/ROW]
[ROW][C]33[/C][C]1.307[/C][C]1.3726[/C][C]-0.0656[/C][/ROW]
[ROW][C]34[/C][C]1.39[/C][C]1.3744[/C][C]0.0155999999999999[/C][/ROW]
[ROW][C]35[/C][C]1.366[/C][C]1.3538[/C][C]0.0122000000000001[/C][/ROW]
[ROW][C]36[/C][C]1.322[/C][C]1.3615[/C][C]-0.0395000000000001[/C][/ROW]
[ROW][C]37[/C][C]1.336[/C][C]1.37[/C][C]-0.0339999999999997[/C][/ROW]
[ROW][C]38[/C][C]1.365[/C][C]1.362[/C][C]0.00299999999999999[/C][/ROW]
[ROW][C]39[/C][C]1.4[/C][C]1.387[/C][C]0.0129999999999999[/C][/ROW]
[ROW][C]40[/C][C]1.444[/C][C]1.399[/C][C]0.045[/C][/ROW]
[ROW][C]41[/C][C]1.435[/C][C]1.3784[/C][C]0.0566000000000001[/C][/ROW]
[ROW][C]42[/C][C]1.439[/C][C]1.374[/C][C]0.0650000000000001[/C][/ROW]
[ROW][C]43[/C][C]1.426[/C][C]1.3836[/C][C]0.0424[/C][/ROW]
[ROW][C]44[/C][C]1.434[/C][C]1.3776[/C][C]0.0564[/C][/ROW]
[ROW][C]45[/C][C]1.377[/C][C]1.3726[/C][C]0.00440000000000004[/C][/ROW]
[ROW][C]46[/C][C]1.371[/C][C]1.3744[/C][C]-0.00339999999999993[/C][/ROW]
[ROW][C]47[/C][C]1.356[/C][C]1.3538[/C][C]0.00220000000000009[/C][/ROW]
[ROW][C]48[/C][C]1.318[/C][C]1.3615[/C][C]-0.0435000000000001[/C][/ROW]
[ROW][C]49[/C][C]1.291[/C][C]1.37[/C][C]-0.0789999999999999[/C][/ROW]
[ROW][C]50[/C][C]1.322[/C][C]1.362[/C][C]-0.04[/C][/ROW]
[ROW][C]51[/C][C]1.32[/C][C]1.387[/C][C]-0.0669999999999999[/C][/ROW]
[ROW][C]52[/C][C]1.316[/C][C]1.399[/C][C]-0.0829999999999999[/C][/ROW]
[ROW][C]53[/C][C]1.279[/C][C]1.3784[/C][C]-0.0994000000000001[/C][/ROW]
[ROW][C]54[/C][C]1.253[/C][C]1.374[/C][C]-0.121[/C][/ROW]
[ROW][C]55[/C][C]1.229[/C][C]1.3836[/C][C]-0.1546[/C][/ROW]
[ROW][C]56[/C][C]1.24[/C][C]1.3776[/C][C]-0.1376[/C][/ROW]
[ROW][C]57[/C][C]1.286[/C][C]1.3726[/C][C]-0.0866[/C][/ROW]
[ROW][C]58[/C][C]1.297[/C][C]1.3744[/C][C]-0.0774[/C][/ROW]
[ROW][C]59[/C][C]1.283[/C][C]1.3538[/C][C]-0.0708000000000001[/C][/ROW]
[/TABLE]
Source: https://freestatistics.org/blog/index.php?pk=199353&T=4

Globally Unique Identifier (entire table): ba.freestatistics.org/blog/index.php?pk=199353&T=4

As an alternative you can also use a QR Code:  

The GUIDs for individual cells are displayed in the table below:

Multiple Linear Regression - Actuals, Interpolation, and Residuals
Time or IndexActualsInterpolationForecastResidualsPrediction Error
11.4721.370.101999999999999
21.4751.3620.113
31.5531.3870.166
41.5751.3990.176
51.5561.37840.1776
61.5551.3740.181
71.5771.38360.1934
81.4981.37760.1204
91.4371.37260.0644000000000001
101.3321.3744-0.0423999999999999
111.2731.3538-0.0808000000000001
121.3451.3615-0.0165000000000001
131.3241.37-0.0459999999999998
141.2791.362-0.0830000000000001
151.3051.387-0.082
161.3191.399-0.08
171.3651.3784-0.0134
181.4021.3740.0279999999999999
191.4091.38360.0254000000000001
201.4271.37760.0494000000000001
211.4561.37260.0834
221.4821.37440.1076
231.4911.35380.1372
241.4611.36150.0994999999999999
251.4271.370.0570000000000002
261.3691.3620.00699999999999999
271.3571.387-0.03
281.3411.399-0.058
291.2571.3784-0.1214
301.2211.374-0.153
311.2771.3836-0.1066
321.2891.3776-0.0886000000000001
331.3071.3726-0.0656
341.391.37440.0155999999999999
351.3661.35380.0122000000000001
361.3221.3615-0.0395000000000001
371.3361.37-0.0339999999999997
381.3651.3620.00299999999999999
391.41.3870.0129999999999999
401.4441.3990.045
411.4351.37840.0566000000000001
421.4391.3740.0650000000000001
431.4261.38360.0424
441.4341.37760.0564
451.3771.37260.00440000000000004
461.3711.3744-0.00339999999999993
471.3561.35380.00220000000000009
481.3181.3615-0.0435000000000001
491.2911.37-0.0789999999999999
501.3221.362-0.04
511.321.387-0.0669999999999999
521.3161.399-0.0829999999999999
531.2791.3784-0.0994000000000001
541.2531.374-0.121
551.2291.3836-0.1546
561.241.3776-0.1376
571.2861.3726-0.0866
581.2971.3744-0.0774
591.2831.3538-0.0708000000000001


Goldfeld-Quandt test for Heteroskedasticity
p-valuesAlternative Hypothesis
breakpoint indexgreater2-sidedless
150.9605993414926110.07880131701477750.0394006585073888
160.9823961305072370.03520773898552550.0176038694927627
170.9822953397421240.03540932051575210.0177046602578761
180.9796740847521850.04065183049563080.0203259152478154
190.9790553570193730.04188928596125440.0209446429806272
200.9699249918429450.06015001631411060.0300750081570553
210.9608996152109940.07820076957801210.0391003847890061
220.9647318764554570.07053624708908680.0352681235445434
230.9821884086695130.0356231826609740.017811591330487
240.983535082926030.03292983414794060.0164649170739703
250.9791256626183610.04174867476327750.0208743373816387
260.9638179071945160.07236418561096730.0361820928054837
270.9439627894133260.1120744211733490.0560372105866743
280.9252728293440440.1494543413119120.0747271706559561
290.9435308127704890.1129383744590230.0564691872295115
300.9710136095206570.05797278095868530.0289863904793426
310.9706622541734760.05867549165304840.0293377458265242
320.9632079447085780.07358411058284350.0367920552914218
330.9466031020026860.1067937959946270.0533968979973136
340.9180915293469270.1638169413061460.0819084706530729
350.8759190609353030.2481618781293930.124080939064697
360.8176250234455110.3647499531089780.182374976554489
370.7479193203641080.5041613592717830.252080679635892
380.6556567621173740.6886864757652530.344343237882626
390.5669129911782480.8661740176435030.433087008821752
400.5124713575095720.9750572849808570.487528642490428
410.4926098467173750.9852196934347510.507390153282625
420.5335099833268780.9329800333462450.466490016673122
430.6362842253765260.7274315492469480.363715774623474
440.8272918957649860.3454162084700280.172708104235014

\begin{tabular}{lllllllll}
\hline
Goldfeld-Quandt test for Heteroskedasticity \tabularnewline
p-values & Alternative Hypothesis \tabularnewline
breakpoint index & greater & 2-sided & less \tabularnewline
15 & 0.960599341492611 & 0.0788013170147775 & 0.0394006585073888 \tabularnewline
16 & 0.982396130507237 & 0.0352077389855255 & 0.0176038694927627 \tabularnewline
17 & 0.982295339742124 & 0.0354093205157521 & 0.0177046602578761 \tabularnewline
18 & 0.979674084752185 & 0.0406518304956308 & 0.0203259152478154 \tabularnewline
19 & 0.979055357019373 & 0.0418892859612544 & 0.0209446429806272 \tabularnewline
20 & 0.969924991842945 & 0.0601500163141106 & 0.0300750081570553 \tabularnewline
21 & 0.960899615210994 & 0.0782007695780121 & 0.0391003847890061 \tabularnewline
22 & 0.964731876455457 & 0.0705362470890868 & 0.0352681235445434 \tabularnewline
23 & 0.982188408669513 & 0.035623182660974 & 0.017811591330487 \tabularnewline
24 & 0.98353508292603 & 0.0329298341479406 & 0.0164649170739703 \tabularnewline
25 & 0.979125662618361 & 0.0417486747632775 & 0.0208743373816387 \tabularnewline
26 & 0.963817907194516 & 0.0723641856109673 & 0.0361820928054837 \tabularnewline
27 & 0.943962789413326 & 0.112074421173349 & 0.0560372105866743 \tabularnewline
28 & 0.925272829344044 & 0.149454341311912 & 0.0747271706559561 \tabularnewline
29 & 0.943530812770489 & 0.112938374459023 & 0.0564691872295115 \tabularnewline
30 & 0.971013609520657 & 0.0579727809586853 & 0.0289863904793426 \tabularnewline
31 & 0.970662254173476 & 0.0586754916530484 & 0.0293377458265242 \tabularnewline
32 & 0.963207944708578 & 0.0735841105828435 & 0.0367920552914218 \tabularnewline
33 & 0.946603102002686 & 0.106793795994627 & 0.0533968979973136 \tabularnewline
34 & 0.918091529346927 & 0.163816941306146 & 0.0819084706530729 \tabularnewline
35 & 0.875919060935303 & 0.248161878129393 & 0.124080939064697 \tabularnewline
36 & 0.817625023445511 & 0.364749953108978 & 0.182374976554489 \tabularnewline
37 & 0.747919320364108 & 0.504161359271783 & 0.252080679635892 \tabularnewline
38 & 0.655656762117374 & 0.688686475765253 & 0.344343237882626 \tabularnewline
39 & 0.566912991178248 & 0.866174017643503 & 0.433087008821752 \tabularnewline
40 & 0.512471357509572 & 0.975057284980857 & 0.487528642490428 \tabularnewline
41 & 0.492609846717375 & 0.985219693434751 & 0.507390153282625 \tabularnewline
42 & 0.533509983326878 & 0.932980033346245 & 0.466490016673122 \tabularnewline
43 & 0.636284225376526 & 0.727431549246948 & 0.363715774623474 \tabularnewline
44 & 0.827291895764986 & 0.345416208470028 & 0.172708104235014 \tabularnewline
\hline
\end{tabular}
%Source: https://freestatistics.org/blog/index.php?pk=199353&T=5

[TABLE]
[ROW][C]Goldfeld-Quandt test for Heteroskedasticity[/C][/ROW]
[ROW][C]p-values[/C][C]Alternative Hypothesis[/C][/ROW]
[ROW][C]breakpoint index[/C][C]greater[/C][C]2-sided[/C][C]less[/C][/ROW]
[ROW][C]15[/C][C]0.960599341492611[/C][C]0.0788013170147775[/C][C]0.0394006585073888[/C][/ROW]
[ROW][C]16[/C][C]0.982396130507237[/C][C]0.0352077389855255[/C][C]0.0176038694927627[/C][/ROW]
[ROW][C]17[/C][C]0.982295339742124[/C][C]0.0354093205157521[/C][C]0.0177046602578761[/C][/ROW]
[ROW][C]18[/C][C]0.979674084752185[/C][C]0.0406518304956308[/C][C]0.0203259152478154[/C][/ROW]
[ROW][C]19[/C][C]0.979055357019373[/C][C]0.0418892859612544[/C][C]0.0209446429806272[/C][/ROW]
[ROW][C]20[/C][C]0.969924991842945[/C][C]0.0601500163141106[/C][C]0.0300750081570553[/C][/ROW]
[ROW][C]21[/C][C]0.960899615210994[/C][C]0.0782007695780121[/C][C]0.0391003847890061[/C][/ROW]
[ROW][C]22[/C][C]0.964731876455457[/C][C]0.0705362470890868[/C][C]0.0352681235445434[/C][/ROW]
[ROW][C]23[/C][C]0.982188408669513[/C][C]0.035623182660974[/C][C]0.017811591330487[/C][/ROW]
[ROW][C]24[/C][C]0.98353508292603[/C][C]0.0329298341479406[/C][C]0.0164649170739703[/C][/ROW]
[ROW][C]25[/C][C]0.979125662618361[/C][C]0.0417486747632775[/C][C]0.0208743373816387[/C][/ROW]
[ROW][C]26[/C][C]0.963817907194516[/C][C]0.0723641856109673[/C][C]0.0361820928054837[/C][/ROW]
[ROW][C]27[/C][C]0.943962789413326[/C][C]0.112074421173349[/C][C]0.0560372105866743[/C][/ROW]
[ROW][C]28[/C][C]0.925272829344044[/C][C]0.149454341311912[/C][C]0.0747271706559561[/C][/ROW]
[ROW][C]29[/C][C]0.943530812770489[/C][C]0.112938374459023[/C][C]0.0564691872295115[/C][/ROW]
[ROW][C]30[/C][C]0.971013609520657[/C][C]0.0579727809586853[/C][C]0.0289863904793426[/C][/ROW]
[ROW][C]31[/C][C]0.970662254173476[/C][C]0.0586754916530484[/C][C]0.0293377458265242[/C][/ROW]
[ROW][C]32[/C][C]0.963207944708578[/C][C]0.0735841105828435[/C][C]0.0367920552914218[/C][/ROW]
[ROW][C]33[/C][C]0.946603102002686[/C][C]0.106793795994627[/C][C]0.0533968979973136[/C][/ROW]
[ROW][C]34[/C][C]0.918091529346927[/C][C]0.163816941306146[/C][C]0.0819084706530729[/C][/ROW]
[ROW][C]35[/C][C]0.875919060935303[/C][C]0.248161878129393[/C][C]0.124080939064697[/C][/ROW]
[ROW][C]36[/C][C]0.817625023445511[/C][C]0.364749953108978[/C][C]0.182374976554489[/C][/ROW]
[ROW][C]37[/C][C]0.747919320364108[/C][C]0.504161359271783[/C][C]0.252080679635892[/C][/ROW]
[ROW][C]38[/C][C]0.655656762117374[/C][C]0.688686475765253[/C][C]0.344343237882626[/C][/ROW]
[ROW][C]39[/C][C]0.566912991178248[/C][C]0.866174017643503[/C][C]0.433087008821752[/C][/ROW]
[ROW][C]40[/C][C]0.512471357509572[/C][C]0.975057284980857[/C][C]0.487528642490428[/C][/ROW]
[ROW][C]41[/C][C]0.492609846717375[/C][C]0.985219693434751[/C][C]0.507390153282625[/C][/ROW]
[ROW][C]42[/C][C]0.533509983326878[/C][C]0.932980033346245[/C][C]0.466490016673122[/C][/ROW]
[ROW][C]43[/C][C]0.636284225376526[/C][C]0.727431549246948[/C][C]0.363715774623474[/C][/ROW]
[ROW][C]44[/C][C]0.827291895764986[/C][C]0.345416208470028[/C][C]0.172708104235014[/C][/ROW]
[/TABLE]
Source: https://freestatistics.org/blog/index.php?pk=199353&T=5

Globally Unique Identifier (entire table): ba.freestatistics.org/blog/index.php?pk=199353&T=5

As an alternative you can also use a QR Code:  

The GUIDs for individual cells are displayed in the table below:

Goldfeld-Quandt test for Heteroskedasticity
p-valuesAlternative Hypothesis
breakpoint indexgreater2-sidedless
150.9605993414926110.07880131701477750.0394006585073888
160.9823961305072370.03520773898552550.0176038694927627
170.9822953397421240.03540932051575210.0177046602578761
180.9796740847521850.04065183049563080.0203259152478154
190.9790553570193730.04188928596125440.0209446429806272
200.9699249918429450.06015001631411060.0300750081570553
210.9608996152109940.07820076957801210.0391003847890061
220.9647318764554570.07053624708908680.0352681235445434
230.9821884086695130.0356231826609740.017811591330487
240.983535082926030.03292983414794060.0164649170739703
250.9791256626183610.04174867476327750.0208743373816387
260.9638179071945160.07236418561096730.0361820928054837
270.9439627894133260.1120744211733490.0560372105866743
280.9252728293440440.1494543413119120.0747271706559561
290.9435308127704890.1129383744590230.0564691872295115
300.9710136095206570.05797278095868530.0289863904793426
310.9706622541734760.05867549165304840.0293377458265242
320.9632079447085780.07358411058284350.0367920552914218
330.9466031020026860.1067937959946270.0533968979973136
340.9180915293469270.1638169413061460.0819084706530729
350.8759190609353030.2481618781293930.124080939064697
360.8176250234455110.3647499531089780.182374976554489
370.7479193203641080.5041613592717830.252080679635892
380.6556567621173740.6886864757652530.344343237882626
390.5669129911782480.8661740176435030.433087008821752
400.5124713575095720.9750572849808570.487528642490428
410.4926098467173750.9852196934347510.507390153282625
420.5335099833268780.9329800333462450.466490016673122
430.6362842253765260.7274315492469480.363715774623474
440.8272918957649860.3454162084700280.172708104235014


Meta Analysis of Goldfeld-Quandt test for Heteroskedasticity
Description# significant tests% significant testsOK/NOK
1% type I error level00OK
5% type I error level70.233333333333333NOK
10% type I error level150.5NOK

\begin{tabular}{lllllllll}
\hline
Meta Analysis of Goldfeld-Quandt test for Heteroskedasticity \tabularnewline
Description & # significant tests & % significant tests & OK/NOK \tabularnewline
1% type I error level & 0 & 0 & OK \tabularnewline
5% type I error level & 7 & 0.233333333333333 & NOK \tabularnewline
10% type I error level & 15 & 0.5 & NOK \tabularnewline
\hline
\end{tabular}
%Source: https://freestatistics.org/blog/index.php?pk=199353&T=6

[TABLE]
[ROW][C]Meta Analysis of Goldfeld-Quandt test for Heteroskedasticity[/C][/ROW]
[ROW][C]Description[/C][C]# significant tests[/C][C]% significant tests[/C][C]OK/NOK[/C][/ROW]
[ROW][C]1% type I error level[/C][C]0[/C][C]0[/C][C]OK[/C][/ROW]
[ROW][C]5% type I error level[/C][C]7[/C][C]0.233333333333333[/C][C]NOK[/C][/ROW]
[ROW][C]10% type I error level[/C][C]15[/C][C]0.5[/C][C]NOK[/C][/ROW]
[/TABLE]
Source: https://freestatistics.org/blog/index.php?pk=199353&T=6

Globally Unique Identifier (entire table): ba.freestatistics.org/blog/index.php?pk=199353&T=6

As an alternative you can also use a QR Code:  

The GUIDs for individual cells are displayed in the table below:

Meta Analysis of Goldfeld-Quandt test for Heteroskedasticity
Description# significant tests% significant testsOK/NOK
1% type I error level00OK
5% type I error level70.233333333333333NOK
10% type I error level150.5NOK


Parameters (Session):
Parameters (R input):
par1 = 1 ; par2 = Include Monthly Dummies ; par3 = No Linear Trend ;
R code (references can be found in the software module):
library(lattice)
library(lmtest)
n25 <- 25 #minimum number of obs. for Goldfeld-Quandt test
par1 <- as.numeric(par1)
x <- t(y)
k <- length(x[1,])
n <- length(x[,1])
x1 <- cbind(x[,par1], x[,1:k!=par1])
mycolnames <- c(colnames(x)[par1], colnames(x)[1:k!=par1])
colnames(x1) <- mycolnames #colnames(x)[par1]
x <- x1
if (par3 == 'First Differences'){
x2 <- array(0, dim=c(n-1,k), dimnames=list(1:(n-1), paste('(1-B)',colnames(x),sep='')))
for (i in 1:n-1) {
for (j in 1:k) {
x2[i,j] <- x[i+1,j] - x[i,j]
}
}
x <- x2
}
if (par2 == 'Include Monthly Dummies'){
x2 <- array(0, dim=c(n,11), dimnames=list(1:n, paste('M', seq(1:11), sep ='')))
for (i in 1:11){
x2[seq(i,n,12),i] <- 1
}
x <- cbind(x, x2)
}
if (par2 == 'Include Quarterly Dummies'){
x2 <- array(0, dim=c(n,3), dimnames=list(1:n, paste('Q', seq(1:3), sep ='')))
for (i in 1:3){
x2[seq(i,n,4),i] <- 1
}
x <- cbind(x, x2)
}
k <- length(x[1,])
if (par3 == 'Linear Trend'){
x <- cbind(x, c(1:n))
colnames(x)[k+1] <- 't'
}
x
k <- length(x[1,])
df <- as.data.frame(x)
(mylm <- lm(df))
(mysum <- summary(mylm))
if (n > n25) {
kp3 <- k + 3
nmkm3 <- n - k - 3
gqarr <- array(NA, dim=c(nmkm3-kp3+1,3))
numgqtests <- 0
numsignificant1 <- 0
numsignificant5 <- 0
numsignificant10 <- 0
for (mypoint in kp3:nmkm3) {
j <- 0
numgqtests <- numgqtests + 1
for (myalt in c('greater', 'two.sided', 'less')) {
j <- j + 1
gqarr[mypoint-kp3+1,j] <- gqtest(mylm, point=mypoint, alternative=myalt)$p.value
}
if (gqarr[mypoint-kp3+1,2] < 0.01) numsignificant1 <- numsignificant1 + 1
if (gqarr[mypoint-kp3+1,2] < 0.05) numsignificant5 <- numsignificant5 + 1
if (gqarr[mypoint-kp3+1,2] < 0.10) numsignificant10 <- numsignificant10 + 1
}
gqarr
}
bitmap(file='test0.png')
plot(x[,1], type='l', main='Actuals and Interpolation', ylab='value of Actuals and Interpolation (dots)', xlab='time or index')
points(x[,1]-mysum$resid)
grid()
dev.off()
bitmap(file='test1.png')
plot(mysum$resid, type='b', pch=19, main='Residuals', ylab='value of Residuals', xlab='time or index')
grid()
dev.off()
bitmap(file='test2.png')
hist(mysum$resid, main='Residual Histogram', xlab='values of Residuals')
grid()
dev.off()
bitmap(file='test3.png')
densityplot(~mysum$resid,col='black',main='Residual Density Plot', xlab='values of Residuals')
dev.off()
bitmap(file='test4.png')
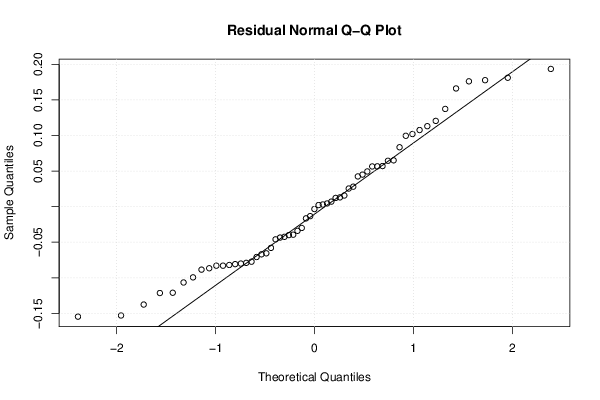
qqnorm(mysum$resid, main='Residual Normal Q-Q Plot')
qqline(mysum$resid)
grid()
dev.off()
(myerror <- as.ts(mysum$resid))
bitmap(file='test5.png')
dum <- cbind(lag(myerror,k=1),myerror)
dum
dum1 <- dum[2:length(myerror),]
dum1
z <- as.data.frame(dum1)
z
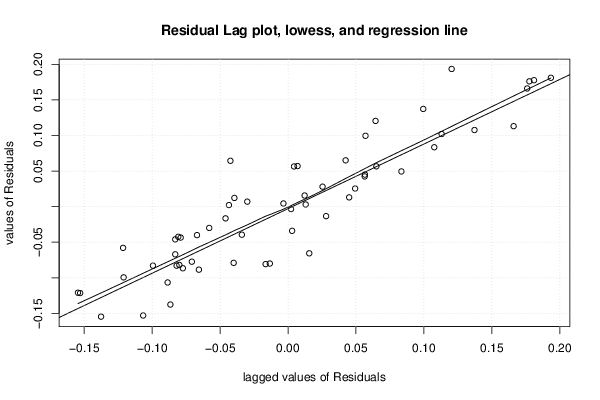
plot(z,main=paste('Residual Lag plot, lowess, and regression line'), ylab='values of Residuals', xlab='lagged values of Residuals')
lines(lowess(z))
abline(lm(z))
grid()
dev.off()
bitmap(file='test6.png')
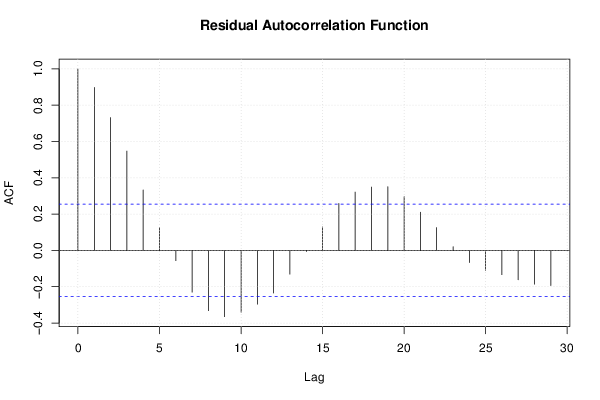
acf(mysum$resid, lag.max=length(mysum$resid)/2, main='Residual Autocorrelation Function')
grid()
dev.off()
bitmap(file='test7.png')
pacf(mysum$resid, lag.max=length(mysum$resid)/2, main='Residual Partial Autocorrelation Function')
grid()
dev.off()
bitmap(file='test8.png')
opar <- par(mfrow = c(2,2), oma = c(0, 0, 1.1, 0))
plot(mylm, las = 1, sub='Residual Diagnostics')
par(opar)
dev.off()
if (n > n25) {
bitmap(file='test9.png')
plot(kp3:nmkm3,gqarr[,2], main='Goldfeld-Quandt test',ylab='2-sided p-value',xlab='breakpoint')
grid()
dev.off()
}
load(file='createtable')
a<-table.start()
a<-table.row.start(a)
a<-table.element(a, 'Multiple Linear Regression - Estimated Regression Equation', 1, TRUE)
a<-table.row.end(a)
myeq <- colnames(x)[1]
myeq <- paste(myeq, '[t] = ', sep='')
for (i in 1:k){
if (mysum$coefficients[i,1] > 0) myeq <- paste(myeq, '+', '')
myeq <- paste(myeq, mysum$coefficients[i,1], sep=' ')
if (rownames(mysum$coefficients)[i] != '(Intercept)') {
myeq <- paste(myeq, rownames(mysum$coefficients)[i], sep='')
if (rownames(mysum$coefficients)[i] != 't') myeq <- paste(myeq, '[t]', sep='')
}
}
myeq <- paste(myeq, ' + e[t]')
a<-table.row.start(a)
a<-table.element(a, myeq)
a<-table.row.end(a)
a<-table.end(a)
table.save(a,file='mytable1.tab')
a<-table.start()
a<-table.row.start(a)
a<-table.element(a,hyperlink('ols1.htm','Multiple Linear Regression - Ordinary Least Squares',''), 6, TRUE)
a<-table.row.end(a)
a<-table.row.start(a)
a<-table.element(a,'Variable',header=TRUE)
a<-table.element(a,'Parameter',header=TRUE)
a<-table.element(a,'S.D.',header=TRUE)
a<-table.element(a,'T-STAT
H0: parameter = 0',header=TRUE)
a<-table.element(a,'2-tail p-value',header=TRUE)
a<-table.element(a,'1-tail p-value',header=TRUE)
a<-table.row.end(a)
for (i in 1:k){
a<-table.row.start(a)
a<-table.element(a,rownames(mysum$coefficients)[i],header=TRUE)
a<-table.element(a,mysum$coefficients[i,1])
a<-table.element(a, round(mysum$coefficients[i,2],6))
a<-table.element(a, round(mysum$coefficients[i,3],4))
a<-table.element(a, round(mysum$coefficients[i,4],6))
a<-table.element(a, round(mysum$coefficients[i,4]/2,6))
a<-table.row.end(a)
}
a<-table.end(a)
table.save(a,file='mytable2.tab')
a<-table.start()
a<-table.row.start(a)
a<-table.element(a, 'Multiple Linear Regression - Regression Statistics', 2, TRUE)
a<-table.row.end(a)
a<-table.row.start(a)
a<-table.element(a, 'Multiple R',1,TRUE)
a<-table.element(a, sqrt(mysum$r.squared))
a<-table.row.end(a)
a<-table.row.start(a)
a<-table.element(a, 'R-squared',1,TRUE)
a<-table.element(a, mysum$r.squared)
a<-table.row.end(a)
a<-table.row.start(a)
a<-table.element(a, 'Adjusted R-squared',1,TRUE)
a<-table.element(a, mysum$adj.r.squared)
a<-table.row.end(a)
a<-table.row.start(a)
a<-table.element(a, 'F-TEST (value)',1,TRUE)
a<-table.element(a, mysum$fstatistic[1])
a<-table.row.end(a)
a<-table.row.start(a)
a<-table.element(a, 'F-TEST (DF numerator)',1,TRUE)
a<-table.element(a, mysum$fstatistic[2])
a<-table.row.end(a)
a<-table.row.start(a)
a<-table.element(a, 'F-TEST (DF denominator)',1,TRUE)
a<-table.element(a, mysum$fstatistic[3])
a<-table.row.end(a)
a<-table.row.start(a)
a<-table.element(a, 'p-value',1,TRUE)
a<-table.element(a, 1-pf(mysum$fstatistic[1],mysum$fstatistic[2],mysum$fstatistic[3]))
a<-table.row.end(a)
a<-table.row.start(a)
a<-table.element(a, 'Multiple Linear Regression - Residual Statistics', 2, TRUE)
a<-table.row.end(a)
a<-table.row.start(a)
a<-table.element(a, 'Residual Standard Deviation',1,TRUE)
a<-table.element(a, mysum$sigma)
a<-table.row.end(a)
a<-table.row.start(a)
a<-table.element(a, 'Sum Squared Residuals',1,TRUE)
a<-table.element(a, sum(myerror*myerror))
a<-table.row.end(a)
a<-table.end(a)
table.save(a,file='mytable3.tab')
a<-table.start()
a<-table.row.start(a)
a<-table.element(a, 'Multiple Linear Regression - Actuals, Interpolation, and Residuals', 4, TRUE)
a<-table.row.end(a)
a<-table.row.start(a)
a<-table.element(a, 'Time or Index', 1, TRUE)
a<-table.element(a, 'Actuals', 1, TRUE)
a<-table.element(a, 'Interpolation
Forecast', 1, TRUE)
a<-table.element(a, 'Residuals
Prediction Error', 1, TRUE)
a<-table.row.end(a)
for (i in 1:n) {
a<-table.row.start(a)
a<-table.element(a,i, 1, TRUE)
a<-table.element(a,x[i])
a<-table.element(a,x[i]-mysum$resid[i])
a<-table.element(a,mysum$resid[i])
a<-table.row.end(a)
}
a<-table.end(a)
table.save(a,file='mytable4.tab')
if (n > n25) {
a<-table.start()
a<-table.row.start(a)
a<-table.element(a,'Goldfeld-Quandt test for Heteroskedasticity',4,TRUE)
a<-table.row.end(a)
a<-table.row.start(a)
a<-table.element(a,'p-values',header=TRUE)
a<-table.element(a,'Alternative Hypothesis',3,header=TRUE)
a<-table.row.end(a)
a<-table.row.start(a)
a<-table.element(a,'breakpoint index',header=TRUE)
a<-table.element(a,'greater',header=TRUE)
a<-table.element(a,'2-sided',header=TRUE)
a<-table.element(a,'less',header=TRUE)
a<-table.row.end(a)
for (mypoint in kp3:nmkm3) {
a<-table.row.start(a)
a<-table.element(a,mypoint,header=TRUE)
a<-table.element(a,gqarr[mypoint-kp3+1,1])
a<-table.element(a,gqarr[mypoint-kp3+1,2])
a<-table.element(a,gqarr[mypoint-kp3+1,3])
a<-table.row.end(a)
}
a<-table.end(a)
table.save(a,file='mytable5.tab')
a<-table.start()
a<-table.row.start(a)
a<-table.element(a,'Meta Analysis of Goldfeld-Quandt test for Heteroskedasticity',4,TRUE)
a<-table.row.end(a)
a<-table.row.start(a)
a<-table.element(a,'Description',header=TRUE)
a<-table.element(a,'# significant tests',header=TRUE)
a<-table.element(a,'% significant tests',header=TRUE)
a<-table.element(a,'OK/NOK',header=TRUE)
a<-table.row.end(a)
a<-table.row.start(a)
a<-table.element(a,'1% type I error level',header=TRUE)
a<-table.element(a,numsignificant1)
a<-table.element(a,numsignificant1/numgqtests)
if (numsignificant1/numgqtests < 0.01) dum <- 'OK' else dum <- 'NOK'
a<-table.element(a,dum)
a<-table.row.end(a)
a<-table.row.start(a)
a<-table.element(a,'5% type I error level',header=TRUE)
a<-table.element(a,numsignificant5)
a<-table.element(a,numsignificant5/numgqtests)
if (numsignificant5/numgqtests < 0.05) dum <- 'OK' else dum <- 'NOK'
a<-table.element(a,dum)
a<-table.row.end(a)
a<-table.row.start(a)
a<-table.element(a,'10% type I error level',header=TRUE)
a<-table.element(a,numsignificant10)
a<-table.element(a,numsignificant10/numgqtests)
if (numsignificant10/numgqtests < 0.1) dum <- 'OK' else dum <- 'NOK'
a<-table.element(a,dum)
a<-table.row.end(a)
a<-table.end(a)
table.save(a,file='mytable6.tab')
}