| Tabulation of Results | |||||||
| A x B | |||||||
| 3 | 4 | 5 | 6 | 7 | 8 | 9 | 2 | 0 | 0 | 0 | 0 | 0 | 2 | 0 | 3 | 2 | 0 | 2 | 0 | 2 | 0 | 2 | 4 | 0 | 2 | 0 | 0 | 0 | 0 | 0 | 5 | 0 | 2 | 2 | 0 | 0 | 0 | 2 | 6 | 0 | 0 | 2 | 2 | 0 | 0 | 0 | 8 | 0 | 0 | 0 | 0 | 0 | 2 | 0 |
| Tabulation of Expected Results | |||||||
| A x B | |||||||
| 3 | 4 | 5 | 6 | 7 | 8 | 9 | 2 | 0.17 | 0.33 | 0.5 | 0.17 | 0.17 | 0.33 | 0.33 | 3 | 0.67 | 1.33 | 2 | 0.67 | 0.67 | 1.33 | 1.33 | 4 | 0.17 | 0.33 | 0.5 | 0.17 | 0.17 | 0.33 | 0.33 | 5 | 0.5 | 1 | 1.5 | 0.5 | 0.5 | 1 | 1 | 6 | 0.33 | 0.67 | 1 | 0.33 | 0.33 | 0.67 | 0.67 | 8 | 0.17 | 0.33 | 0.5 | 0.17 | 0.17 | 0.33 | 0.33 |
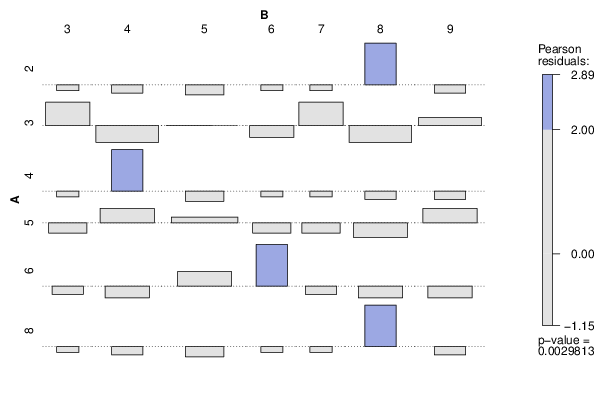
| Statistical Results | |
| Pearson's Chi-squared test | |
| Pearson Chi Square Statistic | 55.67 |
| Degrees of Freedom | 30 |
| P value | 0 |