| Tabulation of Results | |||
| T40 x T20 | |||
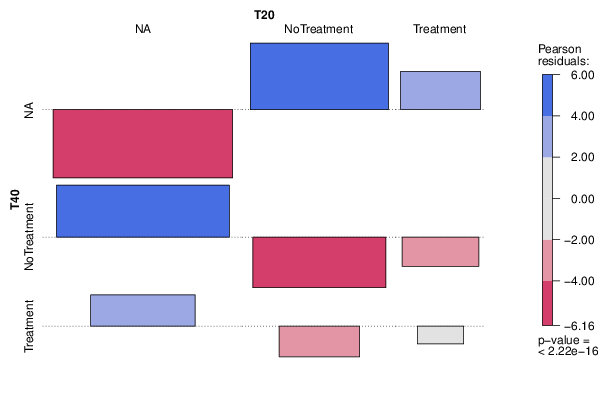
| NA | NoTreatment | Treatment | NA | 0 | 51 | 17 | NoTreatment | 63 | 0 | 0 | Treatment | 23 | 0 | 0 |
| Tabulation of Expected Results | |||
| T40 x T20 | |||
| NA | NoTreatment | Treatment | NA | 37.97 | 22.52 | 7.51 | NoTreatment | 35.18 | 20.86 | 6.95 | Treatment | 12.84 | 7.62 | 2.54 |
| Statistical Results | |
| Pearson's Chi-squared test with simulated p-value (based on 2000 replicates) | |
| Exact Pearson Chi Square Statistic | 154 |
| P value | 0 |