| Tabulation of Results | ||
| CorrectAnalysis x Used | ||
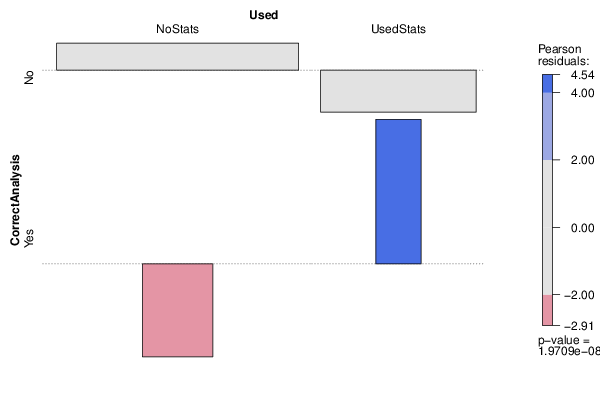
| NoStats | UsedStats | No | 109 | 33 | Yes | 0 | 12 |
| Tabulation of Expected Results | ||
| CorrectAnalysis x Used | ||
| NoStats | UsedStats | No | 100.51 | 41.49 | Yes | 8.49 | 3.51 |
| Statistical Results | |
| Pearson's Chi-squared test with Yates' continuity correction | |
| Pearson Chi Square Statistic | 27.92 |
| Degrees of Freedom | 1 |
| P value | 0 |