\begin{tabular}{lllllllll}
\hline
Summary of computational transaction \tabularnewline
Raw Input & view raw input (R code)  \tabularnewline
Raw Output & view raw output of R engine  \tabularnewline
Computing time & 1 seconds \tabularnewline
R Server & 'Gwilym Jenkins' @ jenkins.wessa.net \tabularnewline
\hline
\end{tabular}
%Source: https://freestatistics.org/blog/index.php?pk=199100&T=0
[TABLE]
[ROW][C]Summary of computational transaction[/C][/ROW]
[ROW][C]Raw Input[/C][C]view raw input (R code) [/C][/ROW]
[ROW][C]Raw Output[/C][C]view raw output of R engine [/C][/ROW]
[ROW][C]Computing time[/C][C]1 seconds[/C][/ROW]
[ROW][C]R Server[/C][C]'Gwilym Jenkins' @ jenkins.wessa.net[/C][/ROW]
[/TABLE]
Source: https://freestatistics.org/blog/index.php?pk=199100&T=0
If you paste this QR Code into your document, anyone with a smartphone or tablet will be able to scan it and view this table in a browser.
If you paste this QR Code into your document, anyone with a smartphone or tablet will be able to scan it and view this table in a browser.
If you paste this QR Code into your document, anyone with a smartphone or tablet will be able to scan it and view this table in a browser.
If you paste this QR Code into your document, anyone with a smartphone or tablet will be able to scan it and view this table in a browser.
If you paste this QR Code into your document, anyone with a smartphone or tablet will be able to scan it and view this table in a browser.
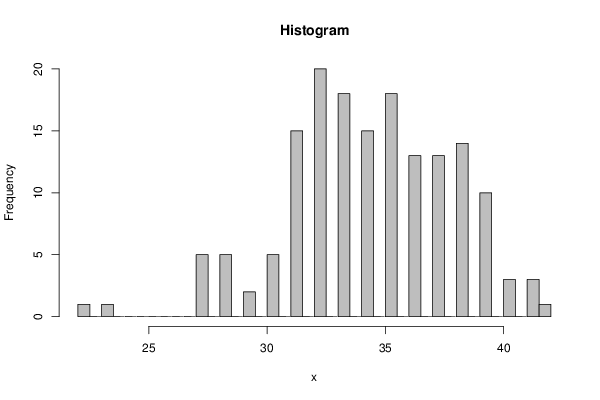
| Frequency Table (Histogram) | | Bins | Midpoint | Abs. Frequency | Rel. Frequency | Cumul. Rel. Freq. | Density | | [22,22.5[ | 22.25 | 1 | 0.006173 | 0.006173 | 0.012346 | | [22.5,23[ | 22.75 | 0 | 0 | 0.006173 | 0 | | [23,23.5[ | 23.25 | 1 | 0.006173 | 0.012346 | 0.012346 | | [23.5,24[ | 23.75 | 0 | 0 | 0.012346 | 0 | | [24,24.5[ | 24.25 | 0 | 0 | 0.012346 | 0 | | [24.5,25[ | 24.75 | 0 | 0 | 0.012346 | 0 | | [25,25.5[ | 25.25 | 0 | 0 | 0.012346 | 0 | | [25.5,26[ | 25.75 | 0 | 0 | 0.012346 | 0 | | [26,26.5[ | 26.25 | 0 | 0 | 0.012346 | 0 | | [26.5,27[ | 26.75 | 0 | 0 | 0.012346 | 0 | | [27,27.5[ | 27.25 | 5 | 0.030864 | 0.04321 | 0.061728 | | [27.5,28[ | 27.75 | 0 | 0 | 0.04321 | 0 | | [28,28.5[ | 28.25 | 5 | 0.030864 | 0.074074 | 0.061728 | | [28.5,29[ | 28.75 | 0 | 0 | 0.074074 | 0 | | [29,29.5[ | 29.25 | 2 | 0.012346 | 0.08642 | 0.024691 | | [29.5,30[ | 29.75 | 0 | 0 | 0.08642 | 0 | | [30,30.5[ | 30.25 | 5 | 0.030864 | 0.117284 | 0.061728 | | [30.5,31[ | 30.75 | 0 | 0 | 0.117284 | 0 | | [31,31.5[ | 31.25 | 15 | 0.092593 | 0.209877 | 0.185185 | | [31.5,32[ | 31.75 | 0 | 0 | 0.209877 | 0 | | [32,32.5[ | 32.25 | 20 | 0.123457 | 0.333333 | 0.246914 | | [32.5,33[ | 32.75 | 0 | 0 | 0.333333 | 0 | | [33,33.5[ | 33.25 | 18 | 0.111111 | 0.444444 | 0.222222 | | [33.5,34[ | 33.75 | 0 | 0 | 0.444444 | 0 | | [34,34.5[ | 34.25 | 15 | 0.092593 | 0.537037 | 0.185185 | | [34.5,35[ | 34.75 | 0 | 0 | 0.537037 | 0 | | [35,35.5[ | 35.25 | 18 | 0.111111 | 0.648148 | 0.222222 | | [35.5,36[ | 35.75 | 0 | 0 | 0.648148 | 0 | | [36,36.5[ | 36.25 | 13 | 0.080247 | 0.728395 | 0.160494 | | [36.5,37[ | 36.75 | 0 | 0 | 0.728395 | 0 | | [37,37.5[ | 37.25 | 13 | 0.080247 | 0.808642 | 0.160494 | | [37.5,38[ | 37.75 | 0 | 0 | 0.808642 | 0 | | [38,38.5[ | 38.25 | 14 | 0.08642 | 0.895062 | 0.17284 | | [38.5,39[ | 38.75 | 0 | 0 | 0.895062 | 0 | | [39,39.5[ | 39.25 | 10 | 0.061728 | 0.95679 | 0.123457 | | [39.5,40[ | 39.75 | 0 | 0 | 0.95679 | 0 | | [40,40.5[ | 40.25 | 3 | 0.018519 | 0.975309 | 0.037037 | | [40.5,41[ | 40.75 | 0 | 0 | 0.975309 | 0 | | [41,41.5[ | 41.25 | 3 | 0.018519 | 0.993827 | 0.037037 | | [41.5,42] | 41.75 | 1 | 0.006173 | 1 | 0.012346 |
\begin{tabular}{lllllllll}
\hline
Frequency Table (Histogram) \tabularnewline
Bins & Midpoint & Abs. Frequency & Rel. Frequency & Cumul. Rel. Freq. & Density \tabularnewline
[22,22.5[ & 22.25 & 1 & 0.006173 & 0.006173 & 0.012346 \tabularnewline
[22.5,23[ & 22.75 & 0 & 0 & 0.006173 & 0 \tabularnewline
[23,23.5[ & 23.25 & 1 & 0.006173 & 0.012346 & 0.012346 \tabularnewline
[23.5,24[ & 23.75 & 0 & 0 & 0.012346 & 0 \tabularnewline
[24,24.5[ & 24.25 & 0 & 0 & 0.012346 & 0 \tabularnewline
[24.5,25[ & 24.75 & 0 & 0 & 0.012346 & 0 \tabularnewline
[25,25.5[ & 25.25 & 0 & 0 & 0.012346 & 0 \tabularnewline
[25.5,26[ & 25.75 & 0 & 0 & 0.012346 & 0 \tabularnewline
[26,26.5[ & 26.25 & 0 & 0 & 0.012346 & 0 \tabularnewline
[26.5,27[ & 26.75 & 0 & 0 & 0.012346 & 0 \tabularnewline
[27,27.5[ & 27.25 & 5 & 0.030864 & 0.04321 & 0.061728 \tabularnewline
[27.5,28[ & 27.75 & 0 & 0 & 0.04321 & 0 \tabularnewline
[28,28.5[ & 28.25 & 5 & 0.030864 & 0.074074 & 0.061728 \tabularnewline
[28.5,29[ & 28.75 & 0 & 0 & 0.074074 & 0 \tabularnewline
[29,29.5[ & 29.25 & 2 & 0.012346 & 0.08642 & 0.024691 \tabularnewline
[29.5,30[ & 29.75 & 0 & 0 & 0.08642 & 0 \tabularnewline
[30,30.5[ & 30.25 & 5 & 0.030864 & 0.117284 & 0.061728 \tabularnewline
[30.5,31[ & 30.75 & 0 & 0 & 0.117284 & 0 \tabularnewline
[31,31.5[ & 31.25 & 15 & 0.092593 & 0.209877 & 0.185185 \tabularnewline
[31.5,32[ & 31.75 & 0 & 0 & 0.209877 & 0 \tabularnewline
[32,32.5[ & 32.25 & 20 & 0.123457 & 0.333333 & 0.246914 \tabularnewline
[32.5,33[ & 32.75 & 0 & 0 & 0.333333 & 0 \tabularnewline
[33,33.5[ & 33.25 & 18 & 0.111111 & 0.444444 & 0.222222 \tabularnewline
[33.5,34[ & 33.75 & 0 & 0 & 0.444444 & 0 \tabularnewline
[34,34.5[ & 34.25 & 15 & 0.092593 & 0.537037 & 0.185185 \tabularnewline
[34.5,35[ & 34.75 & 0 & 0 & 0.537037 & 0 \tabularnewline
[35,35.5[ & 35.25 & 18 & 0.111111 & 0.648148 & 0.222222 \tabularnewline
[35.5,36[ & 35.75 & 0 & 0 & 0.648148 & 0 \tabularnewline
[36,36.5[ & 36.25 & 13 & 0.080247 & 0.728395 & 0.160494 \tabularnewline
[36.5,37[ & 36.75 & 0 & 0 & 0.728395 & 0 \tabularnewline
[37,37.5[ & 37.25 & 13 & 0.080247 & 0.808642 & 0.160494 \tabularnewline
[37.5,38[ & 37.75 & 0 & 0 & 0.808642 & 0 \tabularnewline
[38,38.5[ & 38.25 & 14 & 0.08642 & 0.895062 & 0.17284 \tabularnewline
[38.5,39[ & 38.75 & 0 & 0 & 0.895062 & 0 \tabularnewline
[39,39.5[ & 39.25 & 10 & 0.061728 & 0.95679 & 0.123457 \tabularnewline
[39.5,40[ & 39.75 & 0 & 0 & 0.95679 & 0 \tabularnewline
[40,40.5[ & 40.25 & 3 & 0.018519 & 0.975309 & 0.037037 \tabularnewline
[40.5,41[ & 40.75 & 0 & 0 & 0.975309 & 0 \tabularnewline
[41,41.5[ & 41.25 & 3 & 0.018519 & 0.993827 & 0.037037 \tabularnewline
[41.5,42] & 41.75 & 1 & 0.006173 & 1 & 0.012346 \tabularnewline
\hline
\end{tabular}
%Source: https://freestatistics.org/blog/index.php?pk=199100&T=1
[TABLE]
[ROW][C]Frequency Table (Histogram)[/C][/ROW]
[ROW][C]Bins[/C][C]Midpoint[/C][C]Abs. Frequency[/C][C]Rel. Frequency[/C][C]Cumul. Rel. Freq.[/C][C]Density[/C][/ROW]
[ROW][C][22,22.5[[/C][C]22.25[/C][C]1[/C][C]0.006173[/C][C]0.006173[/C][C]0.012346[/C][/ROW]
[ROW][C][22.5,23[[/C][C]22.75[/C][C]0[/C][C]0[/C][C]0.006173[/C][C]0[/C][/ROW]
[ROW][C][23,23.5[[/C][C]23.25[/C][C]1[/C][C]0.006173[/C][C]0.012346[/C][C]0.012346[/C][/ROW]
[ROW][C][23.5,24[[/C][C]23.75[/C][C]0[/C][C]0[/C][C]0.012346[/C][C]0[/C][/ROW]
[ROW][C][24,24.5[[/C][C]24.25[/C][C]0[/C][C]0[/C][C]0.012346[/C][C]0[/C][/ROW]
[ROW][C][24.5,25[[/C][C]24.75[/C][C]0[/C][C]0[/C][C]0.012346[/C][C]0[/C][/ROW]
[ROW][C][25,25.5[[/C][C]25.25[/C][C]0[/C][C]0[/C][C]0.012346[/C][C]0[/C][/ROW]
[ROW][C][25.5,26[[/C][C]25.75[/C][C]0[/C][C]0[/C][C]0.012346[/C][C]0[/C][/ROW]
[ROW][C][26,26.5[[/C][C]26.25[/C][C]0[/C][C]0[/C][C]0.012346[/C][C]0[/C][/ROW]
[ROW][C][26.5,27[[/C][C]26.75[/C][C]0[/C][C]0[/C][C]0.012346[/C][C]0[/C][/ROW]
[ROW][C][27,27.5[[/C][C]27.25[/C][C]5[/C][C]0.030864[/C][C]0.04321[/C][C]0.061728[/C][/ROW]
[ROW][C][27.5,28[[/C][C]27.75[/C][C]0[/C][C]0[/C][C]0.04321[/C][C]0[/C][/ROW]
[ROW][C][28,28.5[[/C][C]28.25[/C][C]5[/C][C]0.030864[/C][C]0.074074[/C][C]0.061728[/C][/ROW]
[ROW][C][28.5,29[[/C][C]28.75[/C][C]0[/C][C]0[/C][C]0.074074[/C][C]0[/C][/ROW]
[ROW][C][29,29.5[[/C][C]29.25[/C][C]2[/C][C]0.012346[/C][C]0.08642[/C][C]0.024691[/C][/ROW]
[ROW][C][29.5,30[[/C][C]29.75[/C][C]0[/C][C]0[/C][C]0.08642[/C][C]0[/C][/ROW]
[ROW][C][30,30.5[[/C][C]30.25[/C][C]5[/C][C]0.030864[/C][C]0.117284[/C][C]0.061728[/C][/ROW]
[ROW][C][30.5,31[[/C][C]30.75[/C][C]0[/C][C]0[/C][C]0.117284[/C][C]0[/C][/ROW]
[ROW][C][31,31.5[[/C][C]31.25[/C][C]15[/C][C]0.092593[/C][C]0.209877[/C][C]0.185185[/C][/ROW]
[ROW][C][31.5,32[[/C][C]31.75[/C][C]0[/C][C]0[/C][C]0.209877[/C][C]0[/C][/ROW]
[ROW][C][32,32.5[[/C][C]32.25[/C][C]20[/C][C]0.123457[/C][C]0.333333[/C][C]0.246914[/C][/ROW]
[ROW][C][32.5,33[[/C][C]32.75[/C][C]0[/C][C]0[/C][C]0.333333[/C][C]0[/C][/ROW]
[ROW][C][33,33.5[[/C][C]33.25[/C][C]18[/C][C]0.111111[/C][C]0.444444[/C][C]0.222222[/C][/ROW]
[ROW][C][33.5,34[[/C][C]33.75[/C][C]0[/C][C]0[/C][C]0.444444[/C][C]0[/C][/ROW]
[ROW][C][34,34.5[[/C][C]34.25[/C][C]15[/C][C]0.092593[/C][C]0.537037[/C][C]0.185185[/C][/ROW]
[ROW][C][34.5,35[[/C][C]34.75[/C][C]0[/C][C]0[/C][C]0.537037[/C][C]0[/C][/ROW]
[ROW][C][35,35.5[[/C][C]35.25[/C][C]18[/C][C]0.111111[/C][C]0.648148[/C][C]0.222222[/C][/ROW]
[ROW][C][35.5,36[[/C][C]35.75[/C][C]0[/C][C]0[/C][C]0.648148[/C][C]0[/C][/ROW]
[ROW][C][36,36.5[[/C][C]36.25[/C][C]13[/C][C]0.080247[/C][C]0.728395[/C][C]0.160494[/C][/ROW]
[ROW][C][36.5,37[[/C][C]36.75[/C][C]0[/C][C]0[/C][C]0.728395[/C][C]0[/C][/ROW]
[ROW][C][37,37.5[[/C][C]37.25[/C][C]13[/C][C]0.080247[/C][C]0.808642[/C][C]0.160494[/C][/ROW]
[ROW][C][37.5,38[[/C][C]37.75[/C][C]0[/C][C]0[/C][C]0.808642[/C][C]0[/C][/ROW]
[ROW][C][38,38.5[[/C][C]38.25[/C][C]14[/C][C]0.08642[/C][C]0.895062[/C][C]0.17284[/C][/ROW]
[ROW][C][38.5,39[[/C][C]38.75[/C][C]0[/C][C]0[/C][C]0.895062[/C][C]0[/C][/ROW]
[ROW][C][39,39.5[[/C][C]39.25[/C][C]10[/C][C]0.061728[/C][C]0.95679[/C][C]0.123457[/C][/ROW]
[ROW][C][39.5,40[[/C][C]39.75[/C][C]0[/C][C]0[/C][C]0.95679[/C][C]0[/C][/ROW]
[ROW][C][40,40.5[[/C][C]40.25[/C][C]3[/C][C]0.018519[/C][C]0.975309[/C][C]0.037037[/C][/ROW]
[ROW][C][40.5,41[[/C][C]40.75[/C][C]0[/C][C]0[/C][C]0.975309[/C][C]0[/C][/ROW]
[ROW][C][41,41.5[[/C][C]41.25[/C][C]3[/C][C]0.018519[/C][C]0.993827[/C][C]0.037037[/C][/ROW]
[ROW][C][41.5,42][/C][C]41.75[/C][C]1[/C][C]0.006173[/C][C]1[/C][C]0.012346[/C][/ROW]
[/TABLE]
Source: https://freestatistics.org/blog/index.php?pk=199100&T=1
Globally Unique Identifier (entire table): ba.freestatistics.org/blog/index.php?pk=199100&T=1
As an alternative you can also use a QR Code:
The GUIDs for individual cells are displayed in the table below:
| Frequency Table (Histogram) | | Bins | Midpoint | Abs. Frequency | Rel. Frequency | Cumul. Rel. Freq. | Density | | [22,22.5[ | 22.25 | 1 | 0.006173 | 0.006173 | 0.012346 | | [22.5,23[ | 22.75 | 0 | 0 | 0.006173 | 0 | | [23,23.5[ | 23.25 | 1 | 0.006173 | 0.012346 | 0.012346 | | [23.5,24[ | 23.75 | 0 | 0 | 0.012346 | 0 | | [24,24.5[ | 24.25 | 0 | 0 | 0.012346 | 0 | | [24.5,25[ | 24.75 | 0 | 0 | 0.012346 | 0 | | [25,25.5[ | 25.25 | 0 | 0 | 0.012346 | 0 | | [25.5,26[ | 25.75 | 0 | 0 | 0.012346 | 0 | | [26,26.5[ | 26.25 | 0 | 0 | 0.012346 | 0 | | [26.5,27[ | 26.75 | 0 | 0 | 0.012346 | 0 | | [27,27.5[ | 27.25 | 5 | 0.030864 | 0.04321 | 0.061728 | | [27.5,28[ | 27.75 | 0 | 0 | 0.04321 | 0 | | [28,28.5[ | 28.25 | 5 | 0.030864 | 0.074074 | 0.061728 | | [28.5,29[ | 28.75 | 0 | 0 | 0.074074 | 0 | | [29,29.5[ | 29.25 | 2 | 0.012346 | 0.08642 | 0.024691 | | [29.5,30[ | 29.75 | 0 | 0 | 0.08642 | 0 | | [30,30.5[ | 30.25 | 5 | 0.030864 | 0.117284 | 0.061728 | | [30.5,31[ | 30.75 | 0 | 0 | 0.117284 | 0 | | [31,31.5[ | 31.25 | 15 | 0.092593 | 0.209877 | 0.185185 | | [31.5,32[ | 31.75 | 0 | 0 | 0.209877 | 0 | | [32,32.5[ | 32.25 | 20 | 0.123457 | 0.333333 | 0.246914 | | [32.5,33[ | 32.75 | 0 | 0 | 0.333333 | 0 | | [33,33.5[ | 33.25 | 18 | 0.111111 | 0.444444 | 0.222222 | | [33.5,34[ | 33.75 | 0 | 0 | 0.444444 | 0 | | [34,34.5[ | 34.25 | 15 | 0.092593 | 0.537037 | 0.185185 | | [34.5,35[ | 34.75 | 0 | 0 | 0.537037 | 0 | | [35,35.5[ | 35.25 | 18 | 0.111111 | 0.648148 | 0.222222 | | [35.5,36[ | 35.75 | 0 | 0 | 0.648148 | 0 | | [36,36.5[ | 36.25 | 13 | 0.080247 | 0.728395 | 0.160494 | | [36.5,37[ | 36.75 | 0 | 0 | 0.728395 | 0 | | [37,37.5[ | 37.25 | 13 | 0.080247 | 0.808642 | 0.160494 | | [37.5,38[ | 37.75 | 0 | 0 | 0.808642 | 0 | | [38,38.5[ | 38.25 | 14 | 0.08642 | 0.895062 | 0.17284 | | [38.5,39[ | 38.75 | 0 | 0 | 0.895062 | 0 | | [39,39.5[ | 39.25 | 10 | 0.061728 | 0.95679 | 0.123457 | | [39.5,40[ | 39.75 | 0 | 0 | 0.95679 | 0 | | [40,40.5[ | 40.25 | 3 | 0.018519 | 0.975309 | 0.037037 | | [40.5,41[ | 40.75 | 0 | 0 | 0.975309 | 0 | | [41,41.5[ | 41.25 | 3 | 0.018519 | 0.993827 | 0.037037 | | [41.5,42] | 41.75 | 1 | 0.006173 | 1 | 0.012346 |
If you paste this QR Code into your document, anyone with a smartphone or tablet will be able to scan it and view this table in a browser.
If you paste this QR Code into your document, anyone with a smartphone or tablet will be able to scan it and view this table in a browser.
If you paste this QR Code into your document, anyone with a smartphone or tablet will be able to scan it and view this table in a browser.
If you paste this QR Code into your document, anyone with a smartphone or tablet will be able to scan it and view this table in a browser.
If you paste this QR Code into your document, anyone with a smartphone or tablet will be able to scan it and view this table in a browser.
|