| Tabulation of Results | ||
| CorrectAnalysis x T_algemeen | ||
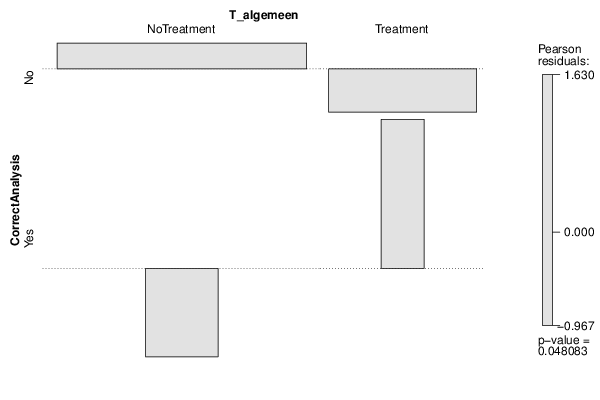
| NoTreatment | Treatment | No | 108 | 34 | Yes | 6 | 6 |
| Tabulation of Expected Results | ||
| CorrectAnalysis x T_algemeen | ||
| NoTreatment | Treatment | No | 105.12 | 36.88 | Yes | 8.88 | 3.12 |
| Statistical Results | |
| Pearson's Chi-squared test with simulated p-value (based on 2000 replicates) | |
| Exact Pearson Chi Square Statistic | 3.91 |
| P value | 0.09 |