| Multiple Linear Regression - Estimated Regression Equation |
| Consumer_confidence_indicator[t] = + 0.12816295679344 + 0.251518670261465General_economic_situation[t] -0.253748943867737Unemployment_in_Belgium[t] + 0.268260092753402Financial_situation_of_households[t] + 0.227502266007022`Saving_capacity_of_households\r`[t] + e[t] |
| Multiple Linear Regression - Ordinary Least Squares | |||||
| Variable | Parameter | S.D. | T-STAT H0: parameter = 0 | 2-tail p-value | 1-tail p-value |
| (Intercept) | 0.12816295679344 | 0.090848 | 1.4107 | 0.16395 | 0.081975 |
| General_economic_situation | 0.251518670261465 | 0.006057 | 41.528 | 0 | 0 |
| Unemployment_in_Belgium | -0.253748943867737 | 0.001736 | -146.1643 | 0 | 0 |
| Financial_situation_of_households | 0.268260092753402 | 0.030223 | 8.876 | 0 | 0 |
| `Saving_capacity_of_households\r` | 0.227502266007022 | 0.016056 | 14.1697 | 0 | 0 |
| Multiple Linear Regression - Regression Statistics | |
| Multiple R | 0.999093894950613 |
| R-squared | 0.998188610927587 |
| Adjusted R-squared | 0.998056873540502 |
| F-TEST (value) | 7577.10952841914 |
| F-TEST (DF numerator) | 4 |
| F-TEST (DF denominator) | 55 |
| p-value | 0 |
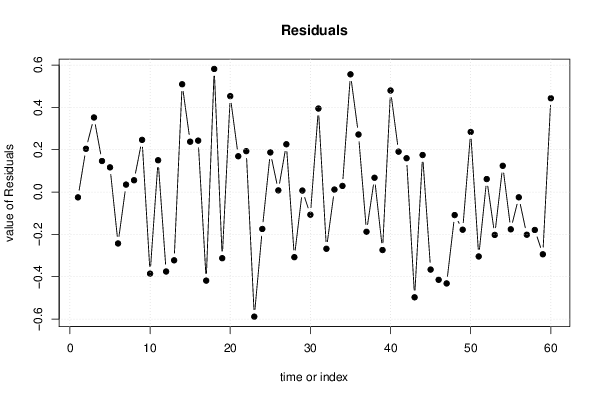
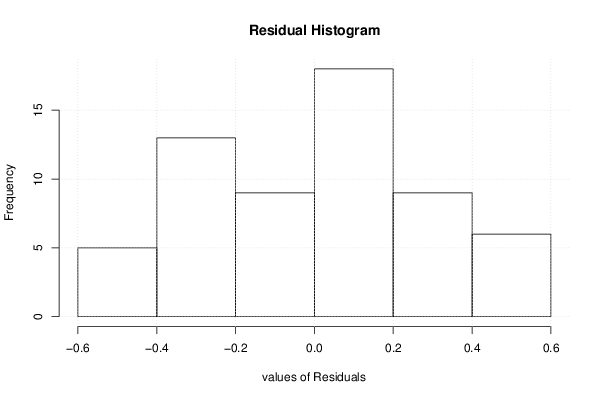
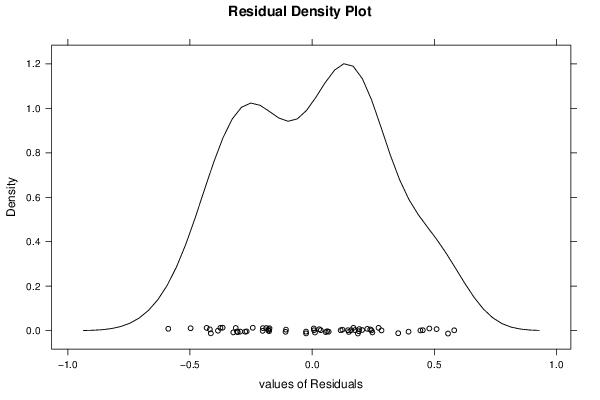
| Multiple Linear Regression - Residual Statistics | |
| Residual Standard Deviation | 0.302202572276616 |
| Sum Squared Residuals | 5.02295170798318 |
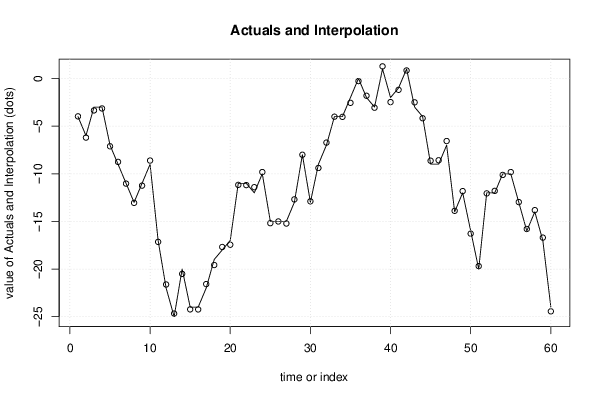
| Multiple Linear Regression - Actuals, Interpolation, and Residuals | |||
| Time or Index | Actuals | Interpolation Forecast | Residuals Prediction Error |
| 1 | -4 | -3.97487580097215 | -0.0251241990278537 |
| 2 | -6 | -6.20443801275842 | 0.204438012758422 |
| 3 | -3 | -3.35234060012069 | 0.352340600120689 |
| 4 | -3 | -3.14658565012249 | 0.146585650122493 |
| 5 | -7 | -7.11667735039278 | 0.116677350392779 |
| 6 | -9 | -8.75702276126514 | -0.242977238734857 |
| 7 | -11 | -11.0351631278646 | 0.0351631278646495 |
| 8 | -13 | -13.0556882380771 | 0.0556882380771122 |
| 9 | -11 | -11.2464793914336 | 0.246479391433623 |
| 10 | -9 | -8.61440600335473 | -0.385593996645266 |
| 11 | -17 | -17.150254951303 | 0.150254951303007 |
| 12 | -22 | -21.6244847584545 | -0.375515241545544 |
| 13 | -25 | -24.6772924129341 | -0.322707587065853 |
| 14 | -20 | -20.5093149791214 | 0.509314979121408 |
| 15 | -24 | -24.2379386108034 | 0.23793861080335 |
| 16 | -24 | -24.2429445043202 | 0.24294450432024 |
| 17 | -22 | -21.581467917212 | -0.418532082787998 |
| 18 | -19 | -19.581638245039 | 0.581638245039021 |
| 19 | -18 | -17.6873406306132 | -0.312659369386756 |
| 20 | -17 | -17.4531087291481 | 0.45310872914806 |
| 21 | -11 | -11.1691247290488 | 0.169124729048775 |
| 22 | -11 | -11.1931411333032 | 0.193141133303219 |
| 23 | -12 | -11.4111769585808 | -0.58882304141919 |
| 24 | -10 | -9.82555517703615 | -0.174444822963854 |
| 25 | -15 | -15.1872492378279 | 0.187249237827948 |
| 26 | -15 | -15.0077797803298 | 0.00777978032981206 |
| 27 | -15 | -15.2257767909681 | 0.225776790968057 |
| 28 | -13 | -12.6922025531989 | -0.307797446801113 |
| 29 | -8 | -8.00686981591368 | 0.00686981591368306 |
| 30 | -13 | -12.8929027212913 | -0.107097278708693 |
| 31 | -9 | -9.39459579016635 | 0.394595790166349 |
| 32 | -7 | -6.73197962206053 | -0.268020377939469 |
| 33 | -4 | -4.01166094503072 | 0.0116609450307205 |
| 34 | -4 | -4.02898652846635 | 0.0289865284663499 |
| 35 | -2 | -2.55621060107074 | 0.556210601070742 |
| 36 | 0 | -0.27188594531742 | 0.27188594531742 |
| 37 | -2 | -1.81225053826381 | -0.187749461736185 |
| 38 | -3 | -3.06761361596487 | 0.0676136159648697 |
| 39 | 1 | 1.27403996119975 | -0.274039961199751 |
| 40 | -2 | -2.47969076734533 | 0.479690767345327 |
| 41 | -1 | -1.1908448446604 | 0.190844844660397 |
| 42 | 1 | 0.840276213529534 | 0.159723786470466 |
| 43 | -3 | -2.50257766435173 | -0.497422335648268 |
| 44 | -4 | -4.17496306723107 | 0.174963067231068 |
| 45 | -9 | -8.63358095913862 | -0.366419040861382 |
| 46 | -9 | -8.58534489094406 | -0.414655109055944 |
| 47 | -7 | -6.56818963533545 | -0.431810364664554 |
| 48 | -14 | -13.8911858151601 | -0.10881418483988 |
| 49 | -12 | -11.8220437354951 | -0.177956264504921 |
| 50 | -16 | -16.2840214082569 | 0.284021408256939 |
| 51 | -20 | -19.6955647180472 | -0.304435281952775 |
| 52 | -12 | -12.0612815304771 | 0.0612815304771498 |
| 53 | -12 | -11.7974819849363 | -0.20251801506371 |
| 54 | -10 | -10.1239958156987 | 0.123995815698721 |
| 55 | -10 | -9.82389899062402 | -0.176101009375976 |
| 56 | -13 | -12.9752057954134 | -0.0247942045865637 |
| 57 | -16 | -15.7982809102798 | -0.201719089720166 |
| 58 | -14 | -13.8207827150594 | -0.17921728494063 |
| 59 | -17 | -16.705856441016 | -0.294143558984026 |
| 60 | -24 | -24.4430993261083 | 0.443099326108313 |
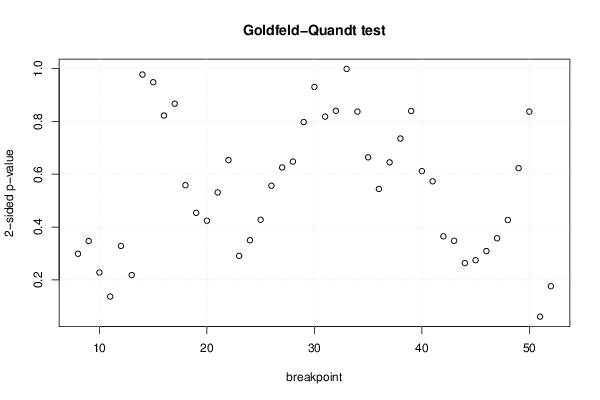
| Goldfeld-Quandt test for Heteroskedasticity | |||
| p-values | Alternative Hypothesis | ||
| breakpoint index | greater | 2-sided | less |
| 8 | 0.149628385514682 | 0.299256771029364 | 0.850371614485318 |
| 9 | 0.173590179243574 | 0.347180358487149 | 0.826409820756426 |
| 10 | 0.114109752590212 | 0.228219505180425 | 0.885890247409788 |
| 11 | 0.0686767377404619 | 0.137353475480924 | 0.931323262259538 |
| 12 | 0.16439327917579 | 0.328786558351581 | 0.83560672082421 |
| 13 | 0.109235653355372 | 0.218471306710744 | 0.890764346644628 |
| 14 | 0.511441794499644 | 0.977116411000712 | 0.488558205500356 |
| 15 | 0.474019340522465 | 0.94803868104493 | 0.525980659477535 |
| 16 | 0.411026547591274 | 0.822053095182548 | 0.588973452408726 |
| 17 | 0.566600591626578 | 0.866798816746845 | 0.433399408373422 |
| 18 | 0.720782318377678 | 0.558435363244644 | 0.279217681622322 |
| 19 | 0.773093786240019 | 0.453812427519963 | 0.226906213759981 |
| 20 | 0.787905563268976 | 0.424188873462049 | 0.212094436731025 |
| 21 | 0.73440822225071 | 0.531183555498579 | 0.26559177774929 |
| 22 | 0.673313706619332 | 0.653372586761336 | 0.326686293380668 |
| 23 | 0.854338777908922 | 0.291322444182156 | 0.145661222091078 |
| 24 | 0.824914493912268 | 0.350171012175465 | 0.175085506087732 |
| 25 | 0.786114444992658 | 0.427771110014685 | 0.213885555007342 |
| 26 | 0.721735994084333 | 0.556528011831335 | 0.278264005915667 |
| 27 | 0.68724157215534 | 0.62551685568932 | 0.31275842784466 |
| 28 | 0.67607155960155 | 0.6478568807969 | 0.32392844039845 |
| 29 | 0.601253330648725 | 0.797493338702551 | 0.398746669351275 |
| 30 | 0.534852157752454 | 0.930295684495092 | 0.465147842247546 |
| 31 | 0.591049947703532 | 0.817900104592937 | 0.408950052296468 |
| 32 | 0.580124493363724 | 0.839751013272552 | 0.419875506636276 |
| 33 | 0.499132540248631 | 0.998265080497262 | 0.500867459751369 |
| 34 | 0.418431927050633 | 0.836863854101265 | 0.581568072949367 |
| 35 | 0.668060499930874 | 0.663879000138253 | 0.331939500069126 |
| 36 | 0.727796974767525 | 0.544406050464951 | 0.272203025232475 |
| 37 | 0.677500078994073 | 0.644999842011854 | 0.322499921005927 |
| 38 | 0.632426971147976 | 0.735146057704049 | 0.367573028852024 |
| 39 | 0.580445296054502 | 0.839109407890995 | 0.419554703945498 |
| 40 | 0.694097912348524 | 0.611804175302953 | 0.305902087651476 |
| 41 | 0.713352058908604 | 0.573295882182793 | 0.286647941091397 |
| 42 | 0.817381332339732 | 0.365237335320537 | 0.182618667660268 |
| 43 | 0.82580454563652 | 0.348390908726961 | 0.17419545436348 |
| 44 | 0.868041703170071 | 0.263916593659858 | 0.131958296829929 |
| 45 | 0.862611173238341 | 0.274777653523317 | 0.137388826761659 |
| 46 | 0.845365665007844 | 0.309268669984312 | 0.154634334992156 |
| 47 | 0.821106439797146 | 0.357787120405707 | 0.178893560202854 |
| 48 | 0.786549744833948 | 0.426900510332104 | 0.213450255166052 |
| 49 | 0.688525785794073 | 0.622948428411854 | 0.311474214205927 |
| 50 | 0.581539383450871 | 0.836921233098257 | 0.418460616549129 |
| 51 | 0.969354922908354 | 0.0612901541832923 | 0.0306450770916462 |
| 52 | 0.911804350910361 | 0.176391298179277 | 0.0881956490896387 |
| Meta Analysis of Goldfeld-Quandt test for Heteroskedasticity | |||
| Description | # significant tests | % significant tests | OK/NOK |
| 1% type I error level | 0 | 0 | OK |
| 5% type I error level | 0 | 0 | OK |
| 10% type I error level | 1 | 0.0222222222222222 | OK |