| Multiple Linear Regression - Estimated Regression Equation |
| Saving_capacity_of_households [t] = + 0.102921236933438 + 3.45038939648647Consumer_confidence_indicator[t] -0.863504206283945General_economic_situation[t] + 0.876633189743982Unemployment_in_Belgium[t] -0.747764331365903Financial_situation_of_households[t] + e[t] |
| Multiple Linear Regression - Ordinary Least Squares | |||||
| Variable | Parameter | S.D. | T-STAT H0: parameter = 0 | 2-tail p-value | 1-tail p-value |
| (Intercept) | 0.102921236933438 | 0.359874 | 0.286 | 0.775958 | 0.387979 |
| Consumer_confidence_indicator | 3.45038939648647 | 0.243505 | 14.1697 | 0 | 0 |
| General_economic_situation | -0.863504206283945 | 0.066662 | -12.9535 | 0 | 0 |
| Unemployment_in_Belgium | 0.876633189743982 | 0.061875 | 14.1677 | 0 | 0 |
| Financial_situation_of_households | -0.747764331365903 | 0.153398 | -4.8747 | 1e-05 | 5e-06 |
| Multiple Linear Regression - Regression Statistics | |
| Multiple R | 0.937814941942371 |
| R-squared | 0.879496865330372 |
| Adjusted R-squared | 0.870733000990763 |
| F-TEST (value) | 100.354915508605 |
| F-TEST (DF numerator) | 4 |
| F-TEST (DF denominator) | 55 |
| p-value | 0 |
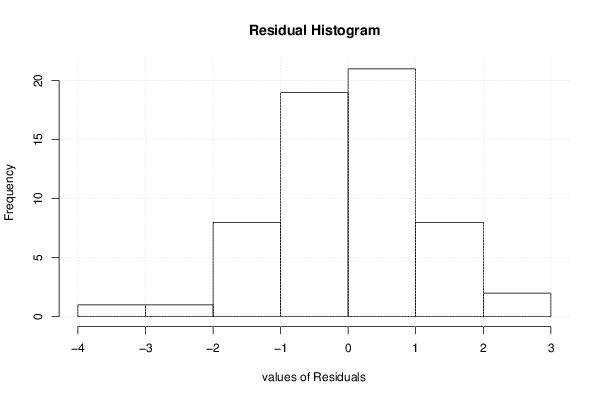
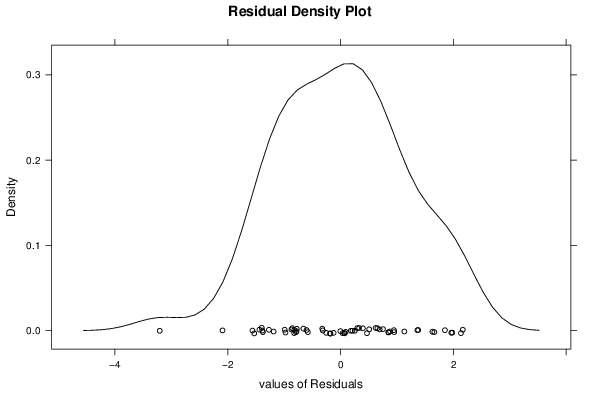
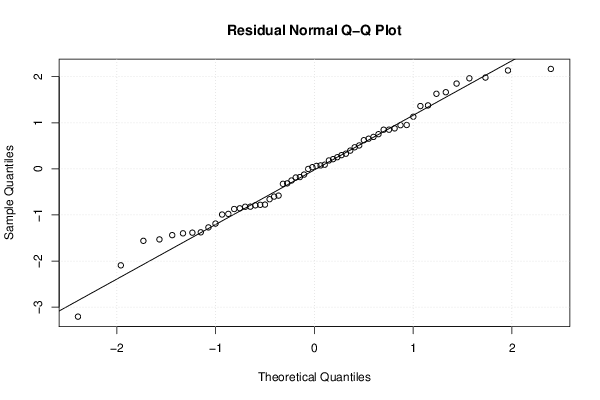
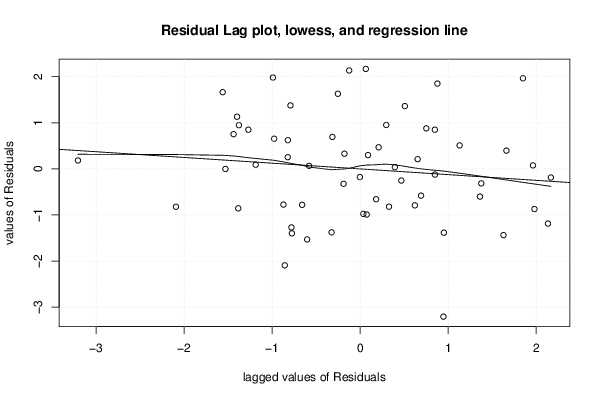
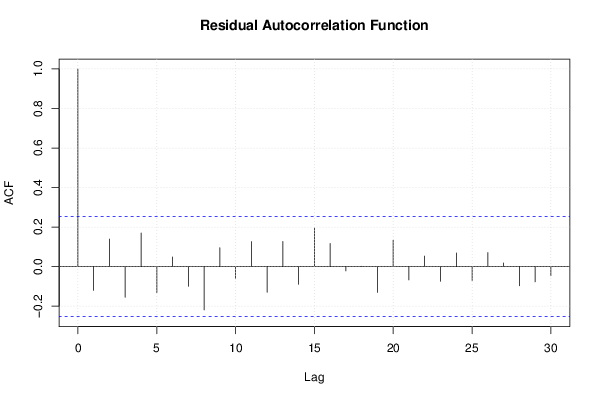
| Multiple Linear Regression - Residual Statistics | |
| Residual Standard Deviation | 1.17689941914075 |
| Sum Squared Residuals | 76.1800733525611 |
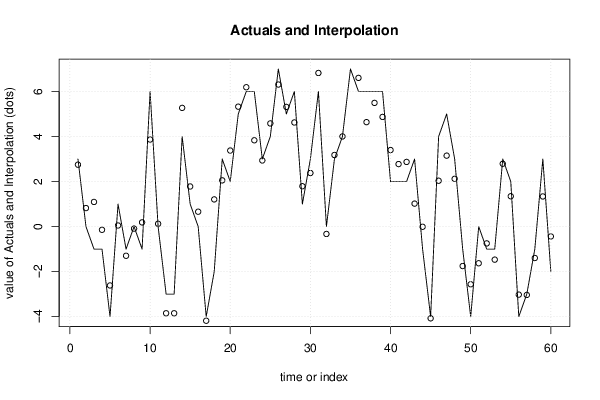
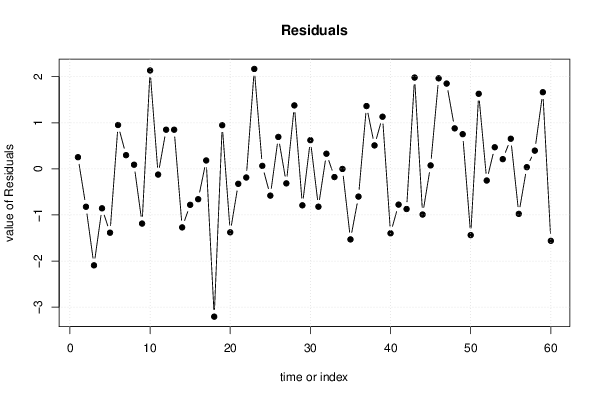
| Multiple Linear Regression - Actuals, Interpolation, and Residuals | |||
| Time or Index | Actuals | Interpolation Forecast | Residuals Prediction Error |
| 1 | 3 | 2.74733052076262 | 0.252669479237381 |
| 2 | 0 | 0.822355182577337 | -0.822355182577337 |
| 3 | -1 | 1.09304760408336 | -2.09304760408336 |
| 4 | -1 | -0.14393419387479 | -0.85606580612521 |
| 5 | -4 | -2.61490523044911 | -1.38509476955089 |
| 6 | 1 | 0.0485071630015301 | 0.95149283699847 |
| 7 | -1 | -1.29695965257604 | 0.296959652576042 |
| 8 | 0 | -0.0896889714771019 | 0.0896889714771019 |
| 9 | -1 | 0.187051854900514 | -1.18705185490051 |
| 10 | 6 | 3.86529357257376 | 2.13470642742624 |
| 11 | 0 | 0.12417647124297 | -0.12417647124297 |
| 12 | -3 | -3.84940380665159 | 0.849403806651591 |
| 13 | -3 | -3.84922952794142 | 0.849229527941418 |
| 14 | 4 | 5.27002184170378 | -1.27002184170378 |
| 15 | 1 | 1.78041977354738 | -0.780419773547376 |
| 16 | 0 | 0.659177850507271 | -0.659177850507271 |
| 17 | -4 | -4.18188261974089 | 0.181882619740894 |
| 18 | -2 | 1.2066110983909 | -3.2066110983909 |
| 19 | 3 | 2.05335889256551 | 0.946641107434494 |
| 20 | 2 | 3.37700431788981 | -1.37700431788981 |
| 21 | 5 | 5.32443591563569 | -0.32443591563569 |
| 22 | 6 | 6.18794012191963 | -0.187940121919635 |
| 23 | 6 | 3.83253468155319 | 2.16746531844681 |
| 24 | 3 | 2.93551765105055 | 0.0644823489494467 |
| 25 | 4 | 4.58047329162927 | -0.580473291629271 |
| 26 | 7 | 6.30748170419716 | 0.692518295802839 |
| 27 | 5 | 5.31510863953514 | -0.315108639535135 |
| 28 | 6 | 4.62331339194851 | 1.37668660805149 |
| 29 | 1 | 1.79147091102951 | -0.791470911029514 |
| 30 | 3 | 2.37840856964602 | 0.621591430353983 |
| 31 | 6 | 6.82099675208434 | -0.82099675208434 |
| 32 | 0 | -0.328192481544213 | 0.328192481544213 |
| 33 | 3 | 3.17816599872154 | -0.178165998721541 |
| 34 | 4 | 4.00228325462538 | -0.00228325462537765 |
| 35 | 7 | 8.53090019512254 | -1.53090019512254 |
| 36 | 6 | 6.60212314957776 | -0.602123149577762 |
| 37 | 6 | 4.63776086101237 | 1.36223913898763 |
| 38 | 6 | 5.49176351248559 | 0.508236487514413 |
| 39 | 6 | 4.86906633213828 | 1.13093366786172 |
| 40 | 2 | 3.39835808683194 | -1.39835808683194 |
| 41 | 2 | 2.77583518519481 | -0.775835185194805 |
| 42 | 2 | 2.87119121935419 | -0.871191219354192 |
| 43 | 3 | 1.01911565576771 | 1.98088434423229 |
| 44 | -1 | -0.00901693062512143 | -0.990983069374879 |
| 45 | -4 | -4.07450009273994 | 0.0745000927399349 |
| 46 | 4 | 2.03567426854787 | 1.96432573145213 |
| 47 | 5 | 3.14966133428936 | 1.85033866571064 |
| 48 | 3 | 2.12187730531688 | 0.878122694683121 |
| 49 | -1 | -1.75225891917183 | 0.752258919171831 |
| 50 | -4 | -2.56186646047843 | -1.43813353952157 |
| 51 | 0 | -1.62891562953482 | 1.62891562953482 |
| 52 | -1 | -0.746756871049769 | -0.253243128950231 |
| 53 | -1 | -1.4682632354956 | 0.468263235495599 |
| 54 | 3 | 2.78948700478537 | 0.210512995214635 |
| 55 | 2 | 1.34647427589371 | 0.653525724106294 |
| 56 | -4 | -3.02338841065599 | -0.976611589344008 |
| 57 | -3 | -3.03634311540585 | 0.0363431154058536 |
| 58 | -1 | -1.3953634608968 | 0.395363460896799 |
| 59 | 3 | 1.33732127850333 | 1.66267872149667 |
| 60 | -2 | -0.438227081835049 | -1.56177291816495 |
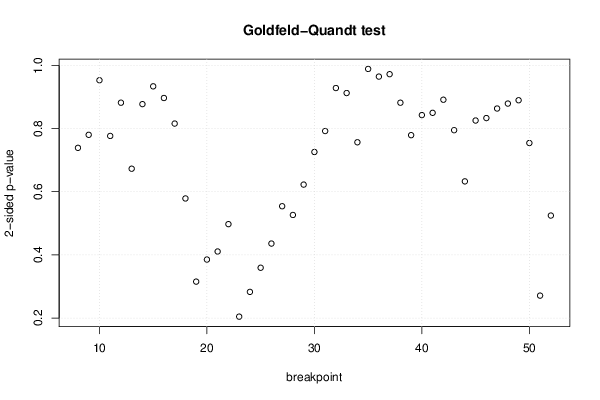
| Goldfeld-Quandt test for Heteroskedasticity | |||
| p-values | Alternative Hypothesis | ||
| breakpoint index | greater | 2-sided | less |
| 8 | 0.369406658157368 | 0.738813316314737 | 0.630593341842632 |
| 9 | 0.390034209837426 | 0.780068419674852 | 0.609965790162574 |
| 10 | 0.476401571366493 | 0.952803142732986 | 0.523598428633507 |
| 11 | 0.388240475008287 | 0.776480950016573 | 0.611759524991713 |
| 12 | 0.440864548896338 | 0.881729097792676 | 0.559135451103662 |
| 13 | 0.336370511455679 | 0.672741022911358 | 0.663629488544321 |
| 14 | 0.561409034556245 | 0.87718193088751 | 0.438590965443755 |
| 15 | 0.533227218127456 | 0.933545563745089 | 0.466772781872544 |
| 16 | 0.448298490427139 | 0.896596980854277 | 0.551701509572861 |
| 17 | 0.407832517000697 | 0.815665034001393 | 0.592167482999304 |
| 18 | 0.710692213825023 | 0.578615572349954 | 0.289307786174977 |
| 19 | 0.842293478235026 | 0.315413043529947 | 0.157706521764974 |
| 20 | 0.807391838807781 | 0.385216322384439 | 0.192608161192219 |
| 21 | 0.794624031525175 | 0.41075193694965 | 0.205375968474825 |
| 22 | 0.751347883800064 | 0.497304232399873 | 0.248652116199936 |
| 23 | 0.897743558721902 | 0.204512882556196 | 0.102256441278098 |
| 24 | 0.858574277217955 | 0.282851445564089 | 0.141425722782045 |
| 25 | 0.82035477437808 | 0.359290451243841 | 0.17964522562192 |
| 26 | 0.782050672404868 | 0.435898655190264 | 0.217949327595132 |
| 27 | 0.723008650168887 | 0.553982699662225 | 0.276991349831113 |
| 28 | 0.736814161344558 | 0.526371677310885 | 0.263185838655442 |
| 29 | 0.688748201396732 | 0.622503597206536 | 0.311251798603268 |
| 30 | 0.637133318108463 | 0.725733363783075 | 0.362866681891537 |
| 31 | 0.603942450660601 | 0.792115098678798 | 0.396057549339399 |
| 32 | 0.535919968162417 | 0.928160063675166 | 0.464080031837583 |
| 33 | 0.456145809262772 | 0.912291618525544 | 0.543854190737228 |
| 34 | 0.378235079573653 | 0.756470159147307 | 0.621764920426347 |
| 35 | 0.505717969537663 | 0.988564060924673 | 0.494282030462337 |
| 36 | 0.517822749607895 | 0.964354500784211 | 0.482177250392105 |
| 37 | 0.514014033025931 | 0.971971933948138 | 0.485985966974069 |
| 38 | 0.440855664005437 | 0.881711328010874 | 0.559144335994563 |
| 39 | 0.389468998946591 | 0.778937997893182 | 0.610531001053409 |
| 40 | 0.421257560694214 | 0.842515121388429 | 0.578742439305786 |
| 41 | 0.424827512878402 | 0.849655025756804 | 0.575172487121598 |
| 42 | 0.55443484284304 | 0.89113031431392 | 0.44556515715696 |
| 43 | 0.602655569733247 | 0.794688860533505 | 0.397344430266753 |
| 44 | 0.683634362372118 | 0.632731275255765 | 0.316365637627882 |
| 45 | 0.587328536094002 | 0.825342927811996 | 0.412671463905998 |
| 46 | 0.583461928527101 | 0.833076142945797 | 0.416538071472899 |
| 47 | 0.568335910194962 | 0.863328179610075 | 0.431664089805038 |
| 48 | 0.560496068300271 | 0.879007863399458 | 0.439503931699729 |
| 49 | 0.444741390904399 | 0.889482781808797 | 0.555258609095601 |
| 50 | 0.377029257863803 | 0.754058515727606 | 0.622970742136197 |
| 51 | 0.864460921574929 | 0.271078156850142 | 0.135539078425071 |
| 52 | 0.737733276312953 | 0.524533447374093 | 0.262266723687047 |
| Meta Analysis of Goldfeld-Quandt test for Heteroskedasticity | |||
| Description | # significant tests | % significant tests | OK/NOK |
| 1% type I error level | 0 | 0 | OK |
| 5% type I error level | 0 | 0 | OK |
| 10% type I error level | 0 | 0 | OK |