Free Statistics

of Irreproducible Research!

Author's title

Author*Unverified author*
R Software Modulerwasp_correlation.wasp
Title produced by softwarePearson Correlation
Date of computationTue, 11 Dec 2012 15:03:20 -0500
Cite this page as followsStatistical Computations at FreeStatistics.org, Office for Research Development and Education, URL https://freestatistics.org/blog/index.php?v=date/2012/Dec/11/t1355256243680daf3kwa9ba3f.htm/, Retrieved Wed, 24 Apr 2024 13:50:00 +0000
Statistical Computations at FreeStatistics.org, Office for Research Development and Education, URL https://freestatistics.org/blog/index.php?pk=198676, Retrieved Wed, 24 Apr 2024 13:50:00 +0000
QR Codes:

Original text written by user:
IsPrivate?No (this computation is public)
User-defined keywords
Estimated Impact74
Family? (F = Feedback message, R = changed R code, M = changed R Module, P = changed Parameters, D = changed Data)
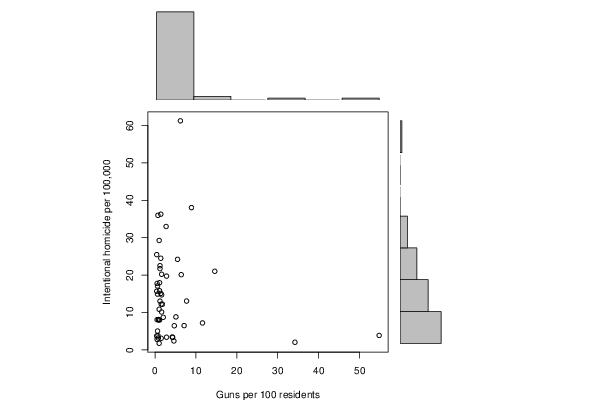
-       [Pearson Correlation] [Guns vs. Intentio...] [2012-12-11 20:03:20] [d41d8cd98f00b204e9800998ecf8427e] [Current]
Feedback Forum

Post a new message
Dataseries X:
0.5
4.7
6.2
34.2
4.2
14.6
7.1
1.5
0.4
7.7
11.6
1.2
1.6
1.5
0.9
2.8
4.3
54.8
1
2.8
5.5
2
0.4
0.5
6.4
2.7
1.4
8.9
1.1
1.4
1.4
1.1
0.8
1.6
0.6
4.6
0.6
1.2
1.8
0.4
1.1
1
5.1
0.8
0.7
0.6
1
0.7
1.2
0.5
1.6
Dataseries Y:
8.071039311
6.454250195
61.25096573
2.038822398
3.437673071
21.02243546
6.492329285
3.099361502
3.723876516
13.05988721
7.201885679
13.03962519
14.71813705
12.22706716
8.012906737
19.7240993
3.353902438
3.862711115
1.763453356
3.389291708
24.21336095
8.712897965
15.67216479
2.81760235
20.10899999
32.99783963
15.10295621
38.04642666
15.82539576
24.50336329
36.28979145
17.95651738
3.17242222
20.22346238
17.07301372
2.386059461
5.0429669
22.51255609
12.1945271
25.47503117
8.001388659
10.85369035
8.825689919
8.124307221
35.97971684
14.91412617
29.25935373
3.820067354
21.7287718
17.76647335
10.14087895


Summary of computational transaction
Raw Inputview raw input (R code)
Raw Outputview raw output of R engine
Computing time1 seconds
R Server'Gertrude Mary Cox' @ cox.wessa.net

\begin{tabular}{lllllllll}
\hline
Summary of computational transaction \tabularnewline
Raw Input & view raw input (R code)  \tabularnewline
Raw Output & view raw output of R engine  \tabularnewline
Computing time & 1 seconds \tabularnewline
R Server & 'Gertrude Mary Cox' @ cox.wessa.net \tabularnewline
\hline
\end{tabular}
%Source: https://freestatistics.org/blog/index.php?pk=198676&T=0

[TABLE]
[ROW][C]Summary of computational transaction[/C][/ROW]
[ROW][C]Raw Input[/C][C]view raw input (R code) [/C][/ROW]
[ROW][C]Raw Output[/C][C]view raw output of R engine [/C][/ROW]
[ROW][C]Computing time[/C][C]1 seconds[/C][/ROW]
[ROW][C]R Server[/C][C]'Gertrude Mary Cox' @ cox.wessa.net[/C][/ROW]
[/TABLE]
Source: https://freestatistics.org/blog/index.php?pk=198676&T=0

Globally Unique Identifier (entire table): ba.freestatistics.org/blog/index.php?pk=198676&T=0

As an alternative you can also use a QR Code:  

The GUIDs for individual cells are displayed in the table below:

Summary of computational transaction
Raw Inputview raw input (R code)
Raw Outputview raw output of R engine
Computing time1 seconds
R Server'Gertrude Mary Cox' @ cox.wessa.net


Pearson Product Moment Correlation - Ungrouped Data
StatisticVariable XVariable Y
Mean4.3588235294117614.6212851023529
Biased Variance78.8232064590542136.407478616058
Biased Standard Deviation8.878243433194111.6793612246585
Covariance-13.7323438848572
Correlation-0.129836966227486
Determination0.0168576377991575
T-Test-0.916617605304145
p-value (2 sided)0.36383252393012
p-value (1 sided)0.18191626196506
Degrees of Freedom49
Number of Observations51

\begin{tabular}{lllllllll}
\hline
Pearson Product Moment Correlation - Ungrouped Data \tabularnewline
Statistic & Variable X & Variable Y \tabularnewline
Mean & 4.35882352941176 & 14.6212851023529 \tabularnewline
Biased Variance & 78.8232064590542 & 136.407478616058 \tabularnewline
Biased Standard Deviation & 8.8782434331941 & 11.6793612246585 \tabularnewline
Covariance & -13.7323438848572 \tabularnewline
Correlation & -0.129836966227486 \tabularnewline
Determination & 0.0168576377991575 \tabularnewline
T-Test & -0.916617605304145 \tabularnewline
p-value (2 sided) & 0.36383252393012 \tabularnewline
p-value (1 sided) & 0.18191626196506 \tabularnewline
Degrees of Freedom & 49 \tabularnewline
Number of Observations & 51 \tabularnewline
\hline
\end{tabular}
%Source: https://freestatistics.org/blog/index.php?pk=198676&T=1

[TABLE]
[ROW][C]Pearson Product Moment Correlation - Ungrouped Data[/C][/ROW]
[ROW][C]Statistic[/C][C]Variable X[/C][C]Variable Y[/C][/ROW]
[ROW][C]Mean[/C][C]4.35882352941176[/C][C]14.6212851023529[/C][/ROW]
[ROW][C]Biased Variance[/C][C]78.8232064590542[/C][C]136.407478616058[/C][/ROW]
[ROW][C]Biased Standard Deviation[/C][C]8.8782434331941[/C][C]11.6793612246585[/C][/ROW]
[ROW][C]Covariance[/C][C]-13.7323438848572[/C][/ROW]
[ROW][C]Correlation[/C][C]-0.129836966227486[/C][/ROW]
[ROW][C]Determination[/C][C]0.0168576377991575[/C][/ROW]
[ROW][C]T-Test[/C][C]-0.916617605304145[/C][/ROW]
[ROW][C]p-value (2 sided)[/C][C]0.36383252393012[/C][/ROW]
[ROW][C]p-value (1 sided)[/C][C]0.18191626196506[/C][/ROW]
[ROW][C]Degrees of Freedom[/C][C]49[/C][/ROW]
[ROW][C]Number of Observations[/C][C]51[/C][/ROW]
[/TABLE]
Source: https://freestatistics.org/blog/index.php?pk=198676&T=1

Globally Unique Identifier (entire table): ba.freestatistics.org/blog/index.php?pk=198676&T=1

As an alternative you can also use a QR Code:  

The GUIDs for individual cells are displayed in the table below:

Pearson Product Moment Correlation - Ungrouped Data
StatisticVariable XVariable Y
Mean4.3588235294117614.6212851023529
Biased Variance78.8232064590542136.407478616058
Biased Standard Deviation8.878243433194111.6793612246585
Covariance-13.7323438848572
Correlation-0.129836966227486
Determination0.0168576377991575
T-Test-0.916617605304145
p-value (2 sided)0.36383252393012
p-value (1 sided)0.18191626196506
Degrees of Freedom49
Number of Observations51


Parameters (Session):
Parameters (R input):
R code (references can be found in the software module):
x <- x[!is.na(y)]
y <- y[!is.na(y)]
y <- y[!is.na(x)]
x <- x[!is.na(x)]
bitmap(file='test1.png')
histx <- hist(x, plot=FALSE)
histy <- hist(y, plot=FALSE)
maxcounts <- max(c(histx$counts, histx$counts))
xrange <- c(min(x),max(x))
yrange <- c(min(y),max(y))
nf <- layout(matrix(c(2,0,1,3),2,2,byrow=TRUE), c(3,1), c(1,3), TRUE)
par(mar=c(4,4,1,1))
plot(x, y, xlim=xrange, ylim=yrange, xlab=xlab, ylab=ylab)
par(mar=c(0,4,1,1))
barplot(histx$counts, axes=FALSE, ylim=c(0, maxcounts), space=0)
par(mar=c(4,0,1,1))
barplot(histy$counts, axes=FALSE, xlim=c(0, maxcounts), space=0, horiz=TRUE)
dev.off()
lx = length(x)
makebiased = (lx-1)/lx
varx = var(x)*makebiased
vary = var(y)*makebiased
corxy <- cor.test(x,y,method='pearson', na.rm = T)
cxy <- as.matrix(corxy$estimate)[1,1]
load(file='createtable')
a<-table.start()
a<-table.row.start(a)
a<-table.element(a,'Pearson Product Moment Correlation - Ungrouped Data',3,TRUE)
a<-table.row.end(a)
a<-table.row.start(a)
a<-table.element(a,'Statistic',1,TRUE)
a<-table.element(a,'Variable X',1,TRUE)
a<-table.element(a,'Variable Y',1,TRUE)
a<-table.row.end(a)
a<-table.row.start(a)
a<-table.element(a,hyperlink('arithmetic_mean.htm','Mean',''),header=TRUE)
a<-table.element(a,mean(x))
a<-table.element(a,mean(y))
a<-table.row.end(a)
a<-table.row.start(a)
a<-table.element(a,hyperlink('biased.htm','Biased Variance',''),header=TRUE)
a<-table.element(a,varx)
a<-table.element(a,vary)
a<-table.row.end(a)
a<-table.row.start(a)
a<-table.element(a,hyperlink('biased1.htm','Biased Standard Deviation',''),header=TRUE)
a<-table.element(a,sqrt(varx))
a<-table.element(a,sqrt(vary))
a<-table.row.end(a)
a<-table.row.start(a)
a<-table.element(a,hyperlink('covariance.htm','Covariance',''),header=TRUE)
a<-table.element(a,cov(x,y),2)
a<-table.row.end(a)
a<-table.row.start(a)
a<-table.element(a,hyperlink('pearson_correlation.htm','Correlation',''),header=TRUE)
a<-table.element(a,cxy,2)
a<-table.row.end(a)
a<-table.row.start(a)
a<-table.element(a,hyperlink('coeff_of_determination.htm','Determination',''),header=TRUE)
a<-table.element(a,cxy*cxy,2)
a<-table.row.end(a)
a<-table.row.start(a)
a<-table.element(a,hyperlink('ttest_statistic.htm','T-Test',''),header=TRUE)
a<-table.element(a,as.matrix(corxy$statistic)[1,1],2)
a<-table.row.end(a)
a<-table.row.start(a)
a<-table.element(a,'p-value (2 sided)',header=TRUE)
a<-table.element(a,(p2 <- as.matrix(corxy$p.value)[1,1]),2)
a<-table.row.end(a)
a<-table.row.start(a)
a<-table.element(a,'p-value (1 sided)',header=TRUE)
a<-table.element(a,p2/2,2)
a<-table.row.end(a)
a<-table.row.start(a)
a<-table.element(a,'Degrees of Freedom',header=TRUE)
a<-table.element(a,lx-2,2)
a<-table.row.end(a)
a<-table.row.start(a)
a<-table.element(a,'Number of Observations',header=TRUE)
a<-table.element(a,lx,2)
a<-table.row.end(a)
a<-table.end(a)
table.save(a,file='mytable.tab')