Free Statistics

of Irreproducible Research!

Author's title

Author*Unverified author*
R Software Modulerwasp_correlation.wasp
Title produced by softwarePearson Correlation
Date of computationTue, 11 Dec 2012 14:51:10 -0500
Cite this page as followsStatistical Computations at FreeStatistics.org, Office for Research Development and Education, URL https://freestatistics.org/blog/index.php?v=date/2012/Dec/11/t1355255552paxr0djsipgz377.htm/, Retrieved Fri, 26 Apr 2024 18:53:21 +0000
Statistical Computations at FreeStatistics.org, Office for Research Development and Education, URL https://freestatistics.org/blog/index.php?pk=198668, Retrieved Fri, 26 Apr 2024 18:53:21 +0000
QR Codes:

Original text written by user:
IsPrivate?No (this computation is public)
User-defined keywords
Estimated Impact82
Family? (F = Feedback message, R = changed R code, M = changed R Module, P = changed Parameters, D = changed Data)
-       [Pearson Correlation] [Guns vs. Intentio...] [2012-12-11 19:51:10] [d41d8cd98f00b204e9800998ecf8427e] [Current]
Feedback Forum

Post a new message
Dataseries X:
21.7
15
31.8
0.7
7.3
4.9
21
6.2
14.7
23.1
1.3
10.7
9.9
58.2
8
24.1
7.3
12.7
18.8
3.5
5.9
5.1
0.1
3.8
17.3
8.6
6.5
7.6
15.6
1.3
4.9
8.1
13.4
6.6
5.8
12.6
10
3.5
6.4
11.5
17.3
12.5
3.5
1.5
7.3
17
5
13.1
0.5
1.9
Dataseries Y:
19.1986642
12.66054399
6.604966516
2.283512797
5.588444625
14.48342128
6.047639561
2.265745018
3.73875744
3.655522621
10.73115923
51.9968201
11.32211324
1.422567613
22.78075733
1.753938078
3.028556706
36.79690672
11.70628687
2.146786529
35.86205879
24.76992116
1.141761387
4.227539945
1.74873164
2.923244097
1.625318562
1.498778844
5.821176903
18.54626322
1.115054801
59.47912753
8.348444665
5.885859465
51.86285367
17.2267059
34.4208771
1.012470134
12.87098797
1.819797467
18.99327441
2.695604249
0.998056641
7.267825576
5.985410164
15.11979791
1.360090159
45.9577151
2.8079531
7.947593866


Summary of computational transaction
Raw Inputview raw input (R code)
Raw Outputview raw output of R engine
Computing time2 seconds
R Server'Gwilym Jenkins' @ jenkins.wessa.net

\begin{tabular}{lllllllll}
\hline
Summary of computational transaction \tabularnewline
Raw Input & view raw input (R code)  \tabularnewline
Raw Output & view raw output of R engine  \tabularnewline
Computing time & 2 seconds \tabularnewline
R Server & 'Gwilym Jenkins' @ jenkins.wessa.net \tabularnewline
\hline
\end{tabular}
%Source: https://freestatistics.org/blog/index.php?pk=198668&T=0

[TABLE]
[ROW][C]Summary of computational transaction[/C][/ROW]
[ROW][C]Raw Input[/C][C]view raw input (R code) [/C][/ROW]
[ROW][C]Raw Output[/C][C]view raw output of R engine [/C][/ROW]
[ROW][C]Computing time[/C][C]2 seconds[/C][/ROW]
[ROW][C]R Server[/C][C]'Gwilym Jenkins' @ jenkins.wessa.net[/C][/ROW]
[/TABLE]
Source: https://freestatistics.org/blog/index.php?pk=198668&T=0

Globally Unique Identifier (entire table): ba.freestatistics.org/blog/index.php?pk=198668&T=0

As an alternative you can also use a QR Code:  

The GUIDs for individual cells are displayed in the table below:

Summary of computational transaction
Raw Inputview raw input (R code)
Raw Outputview raw output of R engine
Computing time2 seconds
R Server'Gwilym Jenkins' @ jenkins.wessa.net


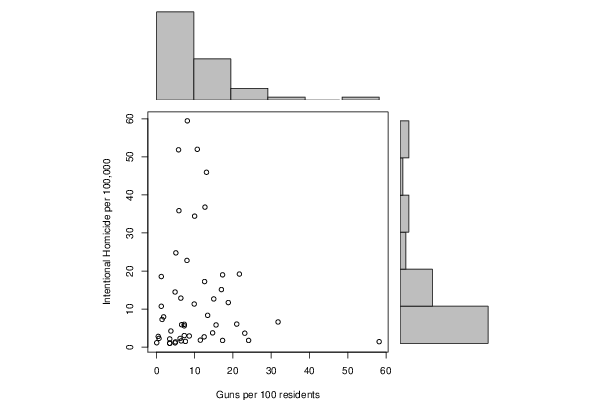
Pearson Product Moment Correlation - Ungrouped Data
StatisticVariable XVariable Y
Mean10.70212.63106809778
Biased Variance94.218196221.111388263661
Biased Standard Deviation9.7066057919336614.8698146681006
Covariance-7.87321115455874
Correlation-0.0534570546897314
Determination0.00285765669610093
T-Test-0.370891658637262
p-value (2 sided)0.712350144897802
p-value (1 sided)0.356175072448901
Degrees of Freedom48
Number of Observations50

\begin{tabular}{lllllllll}
\hline
Pearson Product Moment Correlation - Ungrouped Data \tabularnewline
Statistic & Variable X & Variable Y \tabularnewline
Mean & 10.702 & 12.63106809778 \tabularnewline
Biased Variance & 94.218196 & 221.111388263661 \tabularnewline
Biased Standard Deviation & 9.70660579193366 & 14.8698146681006 \tabularnewline
Covariance & -7.87321115455874 \tabularnewline
Correlation & -0.0534570546897314 \tabularnewline
Determination & 0.00285765669610093 \tabularnewline
T-Test & -0.370891658637262 \tabularnewline
p-value (2 sided) & 0.712350144897802 \tabularnewline
p-value (1 sided) & 0.356175072448901 \tabularnewline
Degrees of Freedom & 48 \tabularnewline
Number of Observations & 50 \tabularnewline
\hline
\end{tabular}
%Source: https://freestatistics.org/blog/index.php?pk=198668&T=1

[TABLE]
[ROW][C]Pearson Product Moment Correlation - Ungrouped Data[/C][/ROW]
[ROW][C]Statistic[/C][C]Variable X[/C][C]Variable Y[/C][/ROW]
[ROW][C]Mean[/C][C]10.702[/C][C]12.63106809778[/C][/ROW]
[ROW][C]Biased Variance[/C][C]94.218196[/C][C]221.111388263661[/C][/ROW]
[ROW][C]Biased Standard Deviation[/C][C]9.70660579193366[/C][C]14.8698146681006[/C][/ROW]
[ROW][C]Covariance[/C][C]-7.87321115455874[/C][/ROW]
[ROW][C]Correlation[/C][C]-0.0534570546897314[/C][/ROW]
[ROW][C]Determination[/C][C]0.00285765669610093[/C][/ROW]
[ROW][C]T-Test[/C][C]-0.370891658637262[/C][/ROW]
[ROW][C]p-value (2 sided)[/C][C]0.712350144897802[/C][/ROW]
[ROW][C]p-value (1 sided)[/C][C]0.356175072448901[/C][/ROW]
[ROW][C]Degrees of Freedom[/C][C]48[/C][/ROW]
[ROW][C]Number of Observations[/C][C]50[/C][/ROW]
[/TABLE]
Source: https://freestatistics.org/blog/index.php?pk=198668&T=1

Globally Unique Identifier (entire table): ba.freestatistics.org/blog/index.php?pk=198668&T=1

As an alternative you can also use a QR Code:  

The GUIDs for individual cells are displayed in the table below:

Pearson Product Moment Correlation - Ungrouped Data
StatisticVariable XVariable Y
Mean10.70212.63106809778
Biased Variance94.218196221.111388263661
Biased Standard Deviation9.7066057919336614.8698146681006
Covariance-7.87321115455874
Correlation-0.0534570546897314
Determination0.00285765669610093
T-Test-0.370891658637262
p-value (2 sided)0.712350144897802
p-value (1 sided)0.356175072448901
Degrees of Freedom48
Number of Observations50


Parameters (Session):
Parameters (R input):
R code (references can be found in the software module):
x <- x[!is.na(y)]
y <- y[!is.na(y)]
y <- y[!is.na(x)]
x <- x[!is.na(x)]
bitmap(file='test1.png')
histx <- hist(x, plot=FALSE)
histy <- hist(y, plot=FALSE)
maxcounts <- max(c(histx$counts, histx$counts))
xrange <- c(min(x),max(x))
yrange <- c(min(y),max(y))
nf <- layout(matrix(c(2,0,1,3),2,2,byrow=TRUE), c(3,1), c(1,3), TRUE)
par(mar=c(4,4,1,1))
plot(x, y, xlim=xrange, ylim=yrange, xlab=xlab, ylab=ylab)
par(mar=c(0,4,1,1))
barplot(histx$counts, axes=FALSE, ylim=c(0, maxcounts), space=0)
par(mar=c(4,0,1,1))
barplot(histy$counts, axes=FALSE, xlim=c(0, maxcounts), space=0, horiz=TRUE)
dev.off()
lx = length(x)
makebiased = (lx-1)/lx
varx = var(x)*makebiased
vary = var(y)*makebiased
corxy <- cor.test(x,y,method='pearson', na.rm = T)
cxy <- as.matrix(corxy$estimate)[1,1]
load(file='createtable')
a<-table.start()
a<-table.row.start(a)
a<-table.element(a,'Pearson Product Moment Correlation - Ungrouped Data',3,TRUE)
a<-table.row.end(a)
a<-table.row.start(a)
a<-table.element(a,'Statistic',1,TRUE)
a<-table.element(a,'Variable X',1,TRUE)
a<-table.element(a,'Variable Y',1,TRUE)
a<-table.row.end(a)
a<-table.row.start(a)
a<-table.element(a,hyperlink('arithmetic_mean.htm','Mean',''),header=TRUE)
a<-table.element(a,mean(x))
a<-table.element(a,mean(y))
a<-table.row.end(a)
a<-table.row.start(a)
a<-table.element(a,hyperlink('biased.htm','Biased Variance',''),header=TRUE)
a<-table.element(a,varx)
a<-table.element(a,vary)
a<-table.row.end(a)
a<-table.row.start(a)
a<-table.element(a,hyperlink('biased1.htm','Biased Standard Deviation',''),header=TRUE)
a<-table.element(a,sqrt(varx))
a<-table.element(a,sqrt(vary))
a<-table.row.end(a)
a<-table.row.start(a)
a<-table.element(a,hyperlink('covariance.htm','Covariance',''),header=TRUE)
a<-table.element(a,cov(x,y),2)
a<-table.row.end(a)
a<-table.row.start(a)
a<-table.element(a,hyperlink('pearson_correlation.htm','Correlation',''),header=TRUE)
a<-table.element(a,cxy,2)
a<-table.row.end(a)
a<-table.row.start(a)
a<-table.element(a,hyperlink('coeff_of_determination.htm','Determination',''),header=TRUE)
a<-table.element(a,cxy*cxy,2)
a<-table.row.end(a)
a<-table.row.start(a)
a<-table.element(a,hyperlink('ttest_statistic.htm','T-Test',''),header=TRUE)
a<-table.element(a,as.matrix(corxy$statistic)[1,1],2)
a<-table.row.end(a)
a<-table.row.start(a)
a<-table.element(a,'p-value (2 sided)',header=TRUE)
a<-table.element(a,(p2 <- as.matrix(corxy$p.value)[1,1]),2)
a<-table.row.end(a)
a<-table.row.start(a)
a<-table.element(a,'p-value (1 sided)',header=TRUE)
a<-table.element(a,p2/2,2)
a<-table.row.end(a)
a<-table.row.start(a)
a<-table.element(a,'Degrees of Freedom',header=TRUE)
a<-table.element(a,lx-2,2)
a<-table.row.end(a)
a<-table.row.start(a)
a<-table.element(a,'Number of Observations',header=TRUE)
a<-table.element(a,lx,2)
a<-table.row.end(a)
a<-table.end(a)
table.save(a,file='mytable.tab')