Free Statistics
of Irreproducible Research!
Description of Statistical Computation | |||||||||||||||||||||||||||||||||||||||||||||||||||||||||||||||||||||||||||||||||||||||||||||||||||||||||||||||||||||||||||||||||||||||||||||||||||||||||||||||||||||||||||||||||||||||||||||||||||||||||||||||||||||||||||||||||||||||||||||||||||||||||||||||||||||
|---|---|---|---|---|---|---|---|---|---|---|---|---|---|---|---|---|---|---|---|---|---|---|---|---|---|---|---|---|---|---|---|---|---|---|---|---|---|---|---|---|---|---|---|---|---|---|---|---|---|---|---|---|---|---|---|---|---|---|---|---|---|---|---|---|---|---|---|---|---|---|---|---|---|---|---|---|---|---|---|---|---|---|---|---|---|---|---|---|---|---|---|---|---|---|---|---|---|---|---|---|---|---|---|---|---|---|---|---|---|---|---|---|---|---|---|---|---|---|---|---|---|---|---|---|---|---|---|---|---|---|---|---|---|---|---|---|---|---|---|---|---|---|---|---|---|---|---|---|---|---|---|---|---|---|---|---|---|---|---|---|---|---|---|---|---|---|---|---|---|---|---|---|---|---|---|---|---|---|---|---|---|---|---|---|---|---|---|---|---|---|---|---|---|---|---|---|---|---|---|---|---|---|---|---|---|---|---|---|---|---|---|---|---|---|---|---|---|---|---|---|---|---|---|---|---|---|---|---|---|---|---|---|---|---|---|---|---|---|---|---|---|---|---|---|---|---|---|---|---|---|---|---|---|---|---|---|---|---|---|---|---|
| Author's title | |||||||||||||||||||||||||||||||||||||||||||||||||||||||||||||||||||||||||||||||||||||||||||||||||||||||||||||||||||||||||||||||||||||||||||||||||||||||||||||||||||||||||||||||||||||||||||||||||||||||||||||||||||||||||||||||||||||||||||||||||||||||||||||||||||||
| Author | *The author of this computation has been verified* | ||||||||||||||||||||||||||||||||||||||||||||||||||||||||||||||||||||||||||||||||||||||||||||||||||||||||||||||||||||||||||||||||||||||||||||||||||||||||||||||||||||||||||||||||||||||||||||||||||||||||||||||||||||||||||||||||||||||||||||||||||||||||||||||||||||
| R Software Module | rwasp_notchedbox1.wasp | ||||||||||||||||||||||||||||||||||||||||||||||||||||||||||||||||||||||||||||||||||||||||||||||||||||||||||||||||||||||||||||||||||||||||||||||||||||||||||||||||||||||||||||||||||||||||||||||||||||||||||||||||||||||||||||||||||||||||||||||||||||||||||||||||||||
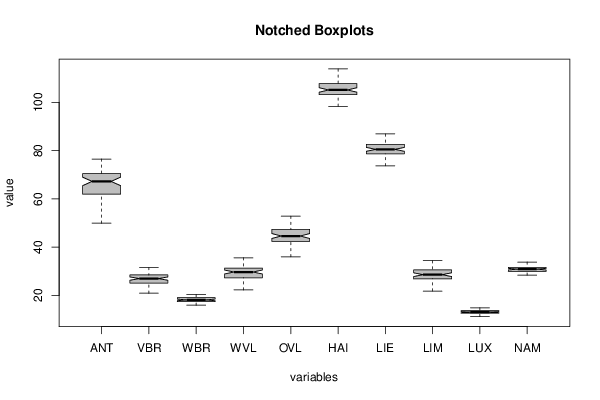
| Title produced by software | Notched Boxplots | ||||||||||||||||||||||||||||||||||||||||||||||||||||||||||||||||||||||||||||||||||||||||||||||||||||||||||||||||||||||||||||||||||||||||||||||||||||||||||||||||||||||||||||||||||||||||||||||||||||||||||||||||||||||||||||||||||||||||||||||||||||||||||||||||||||
| Date of computation | Tue, 11 Dec 2012 11:25:13 -0500 | ||||||||||||||||||||||||||||||||||||||||||||||||||||||||||||||||||||||||||||||||||||||||||||||||||||||||||||||||||||||||||||||||||||||||||||||||||||||||||||||||||||||||||||||||||||||||||||||||||||||||||||||||||||||||||||||||||||||||||||||||||||||||||||||||||||
| Cite this page as follows | Statistical Computations at FreeStatistics.org, Office for Research Development and Education, URL https://freestatistics.org/blog/index.php?v=date/2012/Dec/11/t1355243144e5e94vj70n30zaw.htm/, Retrieved Thu, 18 Apr 2024 06:26:05 +0000 | ||||||||||||||||||||||||||||||||||||||||||||||||||||||||||||||||||||||||||||||||||||||||||||||||||||||||||||||||||||||||||||||||||||||||||||||||||||||||||||||||||||||||||||||||||||||||||||||||||||||||||||||||||||||||||||||||||||||||||||||||||||||||||||||||||||
| Statistical Computations at FreeStatistics.org, Office for Research Development and Education, URL https://freestatistics.org/blog/index.php?pk=198571, Retrieved Thu, 18 Apr 2024 06:26:05 +0000 | |||||||||||||||||||||||||||||||||||||||||||||||||||||||||||||||||||||||||||||||||||||||||||||||||||||||||||||||||||||||||||||||||||||||||||||||||||||||||||||||||||||||||||||||||||||||||||||||||||||||||||||||||||||||||||||||||||||||||||||||||||||||||||||||||||||
| QR Codes: | |||||||||||||||||||||||||||||||||||||||||||||||||||||||||||||||||||||||||||||||||||||||||||||||||||||||||||||||||||||||||||||||||||||||||||||||||||||||||||||||||||||||||||||||||||||||||||||||||||||||||||||||||||||||||||||||||||||||||||||||||||||||||||||||||||||
|
| |||||||||||||||||||||||||||||||||||||||||||||||||||||||||||||||||||||||||||||||||||||||||||||||||||||||||||||||||||||||||||||||||||||||||||||||||||||||||||||||||||||||||||||||||||||||||||||||||||||||||||||||||||||||||||||||||||||||||||||||||||||||||||||||||||||
| Original text written by user: | |||||||||||||||||||||||||||||||||||||||||||||||||||||||||||||||||||||||||||||||||||||||||||||||||||||||||||||||||||||||||||||||||||||||||||||||||||||||||||||||||||||||||||||||||||||||||||||||||||||||||||||||||||||||||||||||||||||||||||||||||||||||||||||||||||||
| IsPrivate? | No (this computation is public) | ||||||||||||||||||||||||||||||||||||||||||||||||||||||||||||||||||||||||||||||||||||||||||||||||||||||||||||||||||||||||||||||||||||||||||||||||||||||||||||||||||||||||||||||||||||||||||||||||||||||||||||||||||||||||||||||||||||||||||||||||||||||||||||||||||||
| User-defined keywords | |||||||||||||||||||||||||||||||||||||||||||||||||||||||||||||||||||||||||||||||||||||||||||||||||||||||||||||||||||||||||||||||||||||||||||||||||||||||||||||||||||||||||||||||||||||||||||||||||||||||||||||||||||||||||||||||||||||||||||||||||||||||||||||||||||||
| Estimated Impact | 71 | ||||||||||||||||||||||||||||||||||||||||||||||||||||||||||||||||||||||||||||||||||||||||||||||||||||||||||||||||||||||||||||||||||||||||||||||||||||||||||||||||||||||||||||||||||||||||||||||||||||||||||||||||||||||||||||||||||||||||||||||||||||||||||||||||||||
Tree of Dependent Computations | |||||||||||||||||||||||||||||||||||||||||||||||||||||||||||||||||||||||||||||||||||||||||||||||||||||||||||||||||||||||||||||||||||||||||||||||||||||||||||||||||||||||||||||||||||||||||||||||||||||||||||||||||||||||||||||||||||||||||||||||||||||||||||||||||||||
| Family? (F = Feedback message, R = changed R code, M = changed R Module, P = changed Parameters, D = changed Data) | |||||||||||||||||||||||||||||||||||||||||||||||||||||||||||||||||||||||||||||||||||||||||||||||||||||||||||||||||||||||||||||||||||||||||||||||||||||||||||||||||||||||||||||||||||||||||||||||||||||||||||||||||||||||||||||||||||||||||||||||||||||||||||||||||||||
| - [Notched Boxplots] [Screen Width and ...] [2010-09-25 10:03:47] [b98453cac15ba1066b407e146608df68] - R D [Notched Boxplots] [Werkloosheid Prov...] [2012-12-11 16:25:13] [b650a28572edc4a1d205c228043a3295] [Current] | |||||||||||||||||||||||||||||||||||||||||||||||||||||||||||||||||||||||||||||||||||||||||||||||||||||||||||||||||||||||||||||||||||||||||||||||||||||||||||||||||||||||||||||||||||||||||||||||||||||||||||||||||||||||||||||||||||||||||||||||||||||||||||||||||||||
| Feedback Forum | |||||||||||||||||||||||||||||||||||||||||||||||||||||||||||||||||||||||||||||||||||||||||||||||||||||||||||||||||||||||||||||||||||||||||||||||||||||||||||||||||||||||||||||||||||||||||||||||||||||||||||||||||||||||||||||||||||||||||||||||||||||||||||||||||||||
Post a new message | |||||||||||||||||||||||||||||||||||||||||||||||||||||||||||||||||||||||||||||||||||||||||||||||||||||||||||||||||||||||||||||||||||||||||||||||||||||||||||||||||||||||||||||||||||||||||||||||||||||||||||||||||||||||||||||||||||||||||||||||||||||||||||||||||||||
Dataset | |||||||||||||||||||||||||||||||||||||||||||||||||||||||||||||||||||||||||||||||||||||||||||||||||||||||||||||||||||||||||||||||||||||||||||||||||||||||||||||||||||||||||||||||||||||||||||||||||||||||||||||||||||||||||||||||||||||||||||||||||||||||||||||||||||||
| Dataseries X: | |||||||||||||||||||||||||||||||||||||||||||||||||||||||||||||||||||||||||||||||||||||||||||||||||||||||||||||||||||||||||||||||||||||||||||||||||||||||||||||||||||||||||||||||||||||||||||||||||||||||||||||||||||||||||||||||||||||||||||||||||||||||||||||||||||||
72.487 28.328 18.984 30.665 45.857 103.070 81.020 29.884 13.667 30.441 73.417 28.905 19.441 30.973 46.726 104.495 82.590 30.485 13.854 30.982 74.592 29.910 20.060 31.794 48.600 106.972 84.766 31.326 14.377 31.609 76.518 31.450 20.370 33.356 50.385 110.188 86.563 32.616 14.767 32.773 73.889 29.970 19.729 30.999 48.299 107.670 84.926 31.262 14.285 31.948 66.856 26.429 17.649 26.523 42.563 98.374 77.669 27.051 12.622 28.848 66.627 26.044 17.740 26.378 42.257 98.870 77.192 26.916 12.520 28.720 67.404 26.335 17.990 27.189 43.087 100.434 78.122 27.380 12.804 29.225 68.677 26.899 18.232 28.534 43.751 101.671 79.593 28.117 13.034 29.724 70.149 27.531 19.070 30.055 45.079 104.718 81.284 29.106 13.568 30.552 70.281 27.876 19.102 30.786 45.173 105.190 81.507 29.467 13.652 30.882 66.445 26.481 18.338 28.746 42.860 102.176 78.882 27.455 13.096 29.978 64.685 26.136 18.670 27.699 41.532 103.209 79.635 26.372 13.075 30.305 66.073 27.117 18.854 27.972 42.923 104.773 80.655 27.483 13.303 30.612 68.474 28.357 19.359 29.343 45.206 106.968 82.731 28.760 13.860 31.593 71.369 29.824 19.738 31.486 47.924 110.051 84.929 30.848 14.431 32.529 71.415 29.466 18.885 31.220 48.444 106.846 82.648 30.979 13.706 31.214 63.910 25.405 17.097 25.893 41.407 98.565 75.456 25.895 12.225 28.427 64.412 25.227 17.243 25.903 41.161 99.513 75.712 25.711 12.390 28.413 65.656 25.897 17.482 26.988 42.542 100.650 77.396 26.744 12.777 29.215 67.149 26.457 17.821 28.403 43.467 102.364 78.790 27.208 13.166 29.941 68.564 27.106 18.023 30.010 44.620 103.163 78.666 28.180 13.324 30.111 69.663 27.640 18.154 30.981 45.671 104.727 79.577 29.134 13.569 30.499 67.840 27.241 18.430 30.464 45.453 103.932 79.365 28.836 13.383 30.512 66.421 27.151 18.582 30.011 44.262 104.743 79.685 27.925 13.530 30.907 69.240 28.528 19.256 30.642 46.029 106.594 81.247 29.116 13.827 31.546 71.483 29.293 19.983 32.032 48.224 110.949 84.348 30.836 14.661 33.035 76.098 31.546 20.209 35.198 52.560 112.899 85.307 34.125 14.887 33.843 75.744 31.018 19.608 35.155 52.826 110.832 83.558 34.396 14.137 32.816 67.339 27.078 17.708 29.589 45.313 102.323 76.614 29.244 12.690 29.836 66.338 26.260 17.421 29.281 44.895 102.265 76.645 28.948 12.529 29.594 68.045 27.078 17.937 30.483 46.454 105.055 78.790 30.136 13.090 30.513 68.932 27.613 18.662 31.682 46.993 107.481 81.327 30.596 13.529 31.488 70.743 28.472 18.998 33.143 48.439 109.589 82.931 31.791 13.788 32.069 71.257 28.645 19.245 33.735 48.695 111.377 84.209 31.988 13.885 32.524 73.335 29.009 18.629 34.412 50.367 107.841 81.061 33.253 13.493 31.198 68.311 27.552 18.577 31.794 46.786 106.798 80.785 29.999 13.375 31.092 68.633 28.233 18.743 31.710 47.736 108.435 82.824 30.591 13.656 31.501 70.290 29.404 19.274 33.112 49.331 111.904 85.899 31.989 14.097 32.774 73.577 31.011 19.691 35.596 52.545 113.824 86.899 34.170 14.421 33.310 72.334 30.042 19.119 35.004 52.043 112.086 85.448 34.109 13.801 32.827 64.702 25.967 17.125 29.823 45.333 104.216 79.197 29.484 12.384 30.045 62.056 24.583 16.962 28.238 43.318 103.930 78.207 27.810 12.365 29.862 62.313 25.056 17.547 29.027 44.052 106.619 81.034 28.458 12.929 30.856 62.885 25.283 17.399 30.065 44.529 106.028 80.377 28.801 12.870 30.925 61.857 24.930 17.349 29.902 44.214 105.908 80.080 28.323 13.006 30.980 60.611 24.835 17.118 29.610 43.440 105.625 79.831 27.916 13.060 30.912 57.875 23.884 16.992 28.112 41.902 104.741 79.089 26.264 12.722 30.441 54.698 22.695 17.007 26.303 39.012 103.497 78.109 24.119 12.522 30.343 55.210 23.333 17.095 26.148 40.133 104.079 78.725 24.538 12.527 30.510 56.195 24.168 17.691 27.446 41.585 107.473 81.450 24.936 13.053 31.511 59.681 26.099 18.171 29.528 44.467 108.831 81.806 27.294 13.126 32.082 59.302 25.828 17.939 29.226 44.630 107.542 80.755 27.544 12.593 31.170 51.515 21.982 16.291 23.943 37.659 99.649 73.841 23.015 11.224 28.516 49.933 20.921 15.966 22.274 36.027 99.384 73.724 21.846 11.233 28.486 52.764 22.036 16.788 23.834 38.156 103.459 77.499 22.822 12.041 29.922 53.213 22.223 16.748 24.583 38.694 103.508 77.079 23.201 12.217 29.942 54.048 22.625 17.786 25.515 38.550 108.383 81.269 23.444 12.803 31.605 55.333 23.238 17.784 26.563 40.033 108.862 81.661 24.534 13.072 31.997 55.462 23.489 17.561 26.834 40.408 107.007 79.663 25.104 12.649 31.404 | |||||||||||||||||||||||||||||||||||||||||||||||||||||||||||||||||||||||||||||||||||||||||||||||||||||||||||||||||||||||||||||||||||||||||||||||||||||||||||||||||||||||||||||||||||||||||||||||||||||||||||||||||||||||||||||||||||||||||||||||||||||||||||||||||||||
Tables (Output of Computation) | |||||||||||||||||||||||||||||||||||||||||||||||||||||||||||||||||||||||||||||||||||||||||||||||||||||||||||||||||||||||||||||||||||||||||||||||||||||||||||||||||||||||||||||||||||||||||||||||||||||||||||||||||||||||||||||||||||||||||||||||||||||||||||||||||||||
| |||||||||||||||||||||||||||||||||||||||||||||||||||||||||||||||||||||||||||||||||||||||||||||||||||||||||||||||||||||||||||||||||||||||||||||||||||||||||||||||||||||||||||||||||||||||||||||||||||||||||||||||||||||||||||||||||||||||||||||||||||||||||||||||||||||
Figures (Output of Computation) | |||||||||||||||||||||||||||||||||||||||||||||||||||||||||||||||||||||||||||||||||||||||||||||||||||||||||||||||||||||||||||||||||||||||||||||||||||||||||||||||||||||||||||||||||||||||||||||||||||||||||||||||||||||||||||||||||||||||||||||||||||||||||||||||||||||
Input Parameters & R Code | |||||||||||||||||||||||||||||||||||||||||||||||||||||||||||||||||||||||||||||||||||||||||||||||||||||||||||||||||||||||||||||||||||||||||||||||||||||||||||||||||||||||||||||||||||||||||||||||||||||||||||||||||||||||||||||||||||||||||||||||||||||||||||||||||||||
| Parameters (Session): | |||||||||||||||||||||||||||||||||||||||||||||||||||||||||||||||||||||||||||||||||||||||||||||||||||||||||||||||||||||||||||||||||||||||||||||||||||||||||||||||||||||||||||||||||||||||||||||||||||||||||||||||||||||||||||||||||||||||||||||||||||||||||||||||||||||
| par1 = grey ; | |||||||||||||||||||||||||||||||||||||||||||||||||||||||||||||||||||||||||||||||||||||||||||||||||||||||||||||||||||||||||||||||||||||||||||||||||||||||||||||||||||||||||||||||||||||||||||||||||||||||||||||||||||||||||||||||||||||||||||||||||||||||||||||||||||||
| Parameters (R input): | |||||||||||||||||||||||||||||||||||||||||||||||||||||||||||||||||||||||||||||||||||||||||||||||||||||||||||||||||||||||||||||||||||||||||||||||||||||||||||||||||||||||||||||||||||||||||||||||||||||||||||||||||||||||||||||||||||||||||||||||||||||||||||||||||||||
| par1 = grey ; | |||||||||||||||||||||||||||||||||||||||||||||||||||||||||||||||||||||||||||||||||||||||||||||||||||||||||||||||||||||||||||||||||||||||||||||||||||||||||||||||||||||||||||||||||||||||||||||||||||||||||||||||||||||||||||||||||||||||||||||||||||||||||||||||||||||
| R code (references can be found in the software module): | |||||||||||||||||||||||||||||||||||||||||||||||||||||||||||||||||||||||||||||||||||||||||||||||||||||||||||||||||||||||||||||||||||||||||||||||||||||||||||||||||||||||||||||||||||||||||||||||||||||||||||||||||||||||||||||||||||||||||||||||||||||||||||||||||||||
par1 <- 'grey' | |||||||||||||||||||||||||||||||||||||||||||||||||||||||||||||||||||||||||||||||||||||||||||||||||||||||||||||||||||||||||||||||||||||||||||||||||||||||||||||||||||||||||||||||||||||||||||||||||||||||||||||||||||||||||||||||||||||||||||||||||||||||||||||||||||||
