Free Statistics

of Irreproducible Research!

Author's title

Author*The author of this computation has been verified*
R Software Modulerwasp_regression_trees1.wasp
Title produced by softwareRecursive Partitioning (Regression Trees)
Date of computationTue, 11 Dec 2012 05:39:37 -0500
Cite this page as followsStatistical Computations at FreeStatistics.org, Office for Research Development and Education, URL https://freestatistics.org/blog/index.php?v=date/2012/Dec/11/t13552224769833k1u4m3a59ya.htm/, Retrieved Thu, 18 Apr 2024 03:44:09 +0000
Statistical Computations at FreeStatistics.org, Office for Research Development and Education, URL https://freestatistics.org/blog/index.php?pk=198401, Retrieved Thu, 18 Apr 2024 03:44:09 +0000
QR Codes:

Original text written by user:
IsPrivate?No (this computation is public)
User-defined keywords
Estimated Impact147
Family? (F = Feedback message, R = changed R code, M = changed R Module, P = changed Parameters, D = changed Data)
-       [Recursive Partitioning (Regression Trees)] [Comp 10 ] [2012-12-11 10:39:37] [18c3d79a4e145c2d06829f66a34e03f3] [Current]
Feedback Forum

Post a new message
Dataseries X:
18.2	2687	1870	1890	145.7	352.2
143.8	13271	9115	8190	-279.0	83.0
23.4	13621	4848	4572	485.0	898.9
1.1	3614	367	90	14.1	24.6
49.5	6425	6131	2448	345.8	682.5
4.8	1022	1754	1370	72.0	119.5
20.8	1093	1679	1070	100.9	164.5
19.4	1529	1295	444	25.6	137.0
2.1	2788	271	304	23.5	28.9
79.4	19788	9084	10636	1092.9	2576.8
2.8	327	542	959	54.1	72.5
3.8	1117	1038	478	59.7	91.7
4.1	5401	550	376	25.6	37.5
13.2	1128	1516	430	-47.0	26.7
2.8	1633	701	679	74.3	135.9
48.5	44736	16197	4653	-732.5	-651.9
6.2	5651	1254	2002	310.7	407.9
10.8	5835	4053	1601	-93.8	173.8
3.8	278	205	853	44.8	50.5
21.9	5074	2557	1892	239.9	578.3
12.6	866	1487	944	71.7	115.4
128.0	4418	8793	4459	283.6	456.5
87.3	6914	7029	7957	400.6	754.7
16.0	862	1601	1093	66.9	106.8
0.7	401	176	1084	55.6	57.0
22.5	430	1155	1045	55.7	70.8
15.4	799	1140	683	57.6	89.2
3.0	4789	453	367	40.2	51.4
2.1	2548	264	181	22.2	26.2
4.1	5249	527	346	37.8	56.2
6.4	3494	1653	1442	160.9	320.3
26.6	1804	2564	483	70.5	164.9
304.0	26432	28285	33172	2336.0	3562.0
18.6	623	2247	797	57.0	93.8
65.0	1608	6615	829	56.1	134.0
66.2	4662	4781	2988	28.7	371.5
83.0	5769	6571	9462	482.0	792.0
62.0	6259	4152	3090	283.7	524.5
1.6	1654	451	779	84.8	130.4
400.2	52634	50056	95697	6555.0	9874.0
23.3	999	1878	393	-173.5	-108.1
4.6	1679	1354	687	93.8	154.6
164.6	4178	17124	2091	180.8	390.4
1.9	223	557	1040	60.6	63.7
57.5	6307	8199	598	-771.5	-524.3
2.4	3720	356	211	26.6	34.8
77.3	3442	5080	2673	235.4	361.5
15.8	33406	3222	1413	201.7	246.7
0.6	1257	355	181	167.5	304.0
3.5	1743	597	717	121.6	172.4
9.0	12505	1302	702	108.4	131.4
62.0	3940	4317	3940	315.2	566.3
7.4	8998	882	988	93.0	119.0
15.6	21419	2516	930	107.6	164.7
25.2	2366	3305	1117	131.2	256.5
25.4	2448	3484	1036	48.8	257.1
3.5	1440	1617	639	81.7	126.4
27.3	14045	15636	2754	418.0	1462.0
37.5	4084	4346	3023	302.7	521.7
3.4	3010	749	1120	146.3	209.2
14.3	1286	1734	361	69.2	145.7
6.1	707	706	275	61.4	77.8
4.9	3086	1739	1507	202.7	335.2
3.3	252	312	883	41.7	60.6
7.0	11052	1097	606	64.9	97.6
8.2	9672	1037	829	92.6	118.2
43.5	1112	3689	542	30.3	96.9
48.5	1104	5123	910	63.7	133.3
5.4	478	672	866	67.1	101.6
49.5	10348	5721	1915	223.6	322.5
29.1	2769	3725	663	-208.4	12.4
2.6	752	2149	101	11.1	15.2
0.8	4989	518	53	-3.1	-0.3
184.8	10528	14992	5377	312.7	710.7
2.3	1995	2662	341	34.7	100.7
8.0	2286	2235	2306	195.3	219.0
10.3	952	1307	309	35.4	92.8
50.0	2957	2806	457	40.6	93.5
118.1	2535	5958	1921	177.0	288.0


Summary of computational transaction
Raw Inputview raw input (R code)
Raw Outputview raw output of R engine
Computing time5 seconds
R Server'Sir Maurice George Kendall' @ kendall.wessa.net

\begin{tabular}{lllllllll}
\hline
Summary of computational transaction \tabularnewline
Raw Input & view raw input (R code)  \tabularnewline
Raw Output & view raw output of R engine  \tabularnewline
Computing time & 5 seconds \tabularnewline
R Server & 'Sir Maurice George Kendall' @ kendall.wessa.net \tabularnewline
\hline
\end{tabular}
%Source: https://freestatistics.org/blog/index.php?pk=198401&T=0

[TABLE]
[ROW][C]Summary of computational transaction[/C][/ROW]
[ROW][C]Raw Input[/C][C]view raw input (R code) [/C][/ROW]
[ROW][C]Raw Output[/C][C]view raw output of R engine [/C][/ROW]
[ROW][C]Computing time[/C][C]5 seconds[/C][/ROW]
[ROW][C]R Server[/C][C]'Sir Maurice George Kendall' @ kendall.wessa.net[/C][/ROW]
[/TABLE]
Source: https://freestatistics.org/blog/index.php?pk=198401&T=0

Globally Unique Identifier (entire table): ba.freestatistics.org/blog/index.php?pk=198401&T=0

As an alternative you can also use a QR Code:  

The GUIDs for individual cells are displayed in the table below:

Summary of computational transaction
Raw Inputview raw input (R code)
Raw Outputview raw output of R engine
Computing time5 seconds
R Server'Sir Maurice George Kendall' @ kendall.wessa.net


Goodness of Fit
Correlation0.781
R-squared0.6099
RMSE40.0299

\begin{tabular}{lllllllll}
\hline
Goodness of Fit \tabularnewline
Correlation & 0.781 \tabularnewline
R-squared & 0.6099 \tabularnewline
RMSE & 40.0299 \tabularnewline
\hline
\end{tabular}
%Source: https://freestatistics.org/blog/index.php?pk=198401&T=1

[TABLE]
[ROW][C]Goodness of Fit[/C][/ROW]
[ROW][C]Correlation[/C][C]0.781[/C][/ROW]
[ROW][C]R-squared[/C][C]0.6099[/C][/ROW]
[ROW][C]RMSE[/C][C]40.0299[/C][/ROW]
[/TABLE]
Source: https://freestatistics.org/blog/index.php?pk=198401&T=1

Globally Unique Identifier (entire table): ba.freestatistics.org/blog/index.php?pk=198401&T=1

As an alternative you can also use a QR Code:  

The GUIDs for individual cells are displayed in the table below:

Goodness of Fit
Correlation0.781
R-squared0.6099
RMSE40.0299


Actuals, Predictions, and Residuals
#ActualsForecastsResiduals
118.211.86.4
2143.8164.511111111111-20.7111111111111
323.463.3428571428571-39.9428571428571
41.12.36875-1.26875
549.563.3428571428571-13.8428571428571
64.811.8-7
720.811.89
819.411.87.6
92.12.36875-0.26875
1079.4164.511111111111-85.1111111111111
112.82.368750.43125
123.85.5125-1.7125
134.12.368751.73125
1413.211.81.4
152.85.5125-2.7125
1648.5164.511111111111-116.011111111111
176.211.8-5.6
1810.823.7333333333333-12.9333333333333
193.82.368751.43125
2021.923.7333333333333-1.83333333333334
2112.611.80.799999999999999
22128164.511111111111-36.5111111111111
2387.363.342857142857123.9571428571429
241611.84.2
250.72.36875-1.66875
2622.511.810.7
2715.411.83.6
2832.368750.63125
292.12.36875-0.26875
304.12.368751.73125
316.411.8-5.4
3226.623.73333333333332.86666666666667
33304164.511111111111139.488888888889
3418.623.7333333333333-5.13333333333333
356563.34285714285711.65714285714286
3666.263.34285714285712.85714285714286
378363.342857142857119.6571428571429
386263.3428571428571-1.34285714285714
391.62.36875-0.76875
40400.2164.511111111111235.688888888889
4123.311.811.5
424.611.8-7.2
43164.6164.5111111111110.0888888888888744
441.92.36875-0.46875
4557.563.3428571428571-5.84285714285714
462.42.368750.03125
4777.363.342857142857113.9571428571429
4815.823.7333333333333-7.93333333333333
490.62.36875-1.76875
503.52.368751.13125
51911.8-2.8
526263.3428571428571-1.34285714285714
537.45.51251.8875
5415.623.7333333333333-8.13333333333333
5525.223.73333333333331.46666666666667
5625.423.73333333333331.66666666666666
573.511.8-8.3
5827.3164.511111111111-137.211111111111
5937.563.3428571428571-25.8428571428571
603.45.5125-2.1125
6114.311.82.5
626.15.51250.587499999999999
634.911.8-6.9
643.32.368750.93125
6575.51251.4875
668.25.51252.6875
6743.523.733333333333319.7666666666667
6848.563.3428571428571-14.8428571428571
695.45.5125-0.1125
7049.563.3428571428571-13.8428571428571
7129.123.73333333333335.36666666666667
722.611.8-9.2
730.82.36875-1.56875
74184.8164.51111111111120.2888888888889
752.323.7333333333333-21.4333333333333
76811.8-3.8
7710.311.8-1.5
785023.733333333333326.2666666666667
79118.163.342857142857154.7571428571429

\begin{tabular}{lllllllll}
\hline
Actuals, Predictions, and Residuals \tabularnewline
# & Actuals & Forecasts & Residuals \tabularnewline
1 & 18.2 & 11.8 & 6.4 \tabularnewline
2 & 143.8 & 164.511111111111 & -20.7111111111111 \tabularnewline
3 & 23.4 & 63.3428571428571 & -39.9428571428571 \tabularnewline
4 & 1.1 & 2.36875 & -1.26875 \tabularnewline
5 & 49.5 & 63.3428571428571 & -13.8428571428571 \tabularnewline
6 & 4.8 & 11.8 & -7 \tabularnewline
7 & 20.8 & 11.8 & 9 \tabularnewline
8 & 19.4 & 11.8 & 7.6 \tabularnewline
9 & 2.1 & 2.36875 & -0.26875 \tabularnewline
10 & 79.4 & 164.511111111111 & -85.1111111111111 \tabularnewline
11 & 2.8 & 2.36875 & 0.43125 \tabularnewline
12 & 3.8 & 5.5125 & -1.7125 \tabularnewline
13 & 4.1 & 2.36875 & 1.73125 \tabularnewline
14 & 13.2 & 11.8 & 1.4 \tabularnewline
15 & 2.8 & 5.5125 & -2.7125 \tabularnewline
16 & 48.5 & 164.511111111111 & -116.011111111111 \tabularnewline
17 & 6.2 & 11.8 & -5.6 \tabularnewline
18 & 10.8 & 23.7333333333333 & -12.9333333333333 \tabularnewline
19 & 3.8 & 2.36875 & 1.43125 \tabularnewline
20 & 21.9 & 23.7333333333333 & -1.83333333333334 \tabularnewline
21 & 12.6 & 11.8 & 0.799999999999999 \tabularnewline
22 & 128 & 164.511111111111 & -36.5111111111111 \tabularnewline
23 & 87.3 & 63.3428571428571 & 23.9571428571429 \tabularnewline
24 & 16 & 11.8 & 4.2 \tabularnewline
25 & 0.7 & 2.36875 & -1.66875 \tabularnewline
26 & 22.5 & 11.8 & 10.7 \tabularnewline
27 & 15.4 & 11.8 & 3.6 \tabularnewline
28 & 3 & 2.36875 & 0.63125 \tabularnewline
29 & 2.1 & 2.36875 & -0.26875 \tabularnewline
30 & 4.1 & 2.36875 & 1.73125 \tabularnewline
31 & 6.4 & 11.8 & -5.4 \tabularnewline
32 & 26.6 & 23.7333333333333 & 2.86666666666667 \tabularnewline
33 & 304 & 164.511111111111 & 139.488888888889 \tabularnewline
34 & 18.6 & 23.7333333333333 & -5.13333333333333 \tabularnewline
35 & 65 & 63.3428571428571 & 1.65714285714286 \tabularnewline
36 & 66.2 & 63.3428571428571 & 2.85714285714286 \tabularnewline
37 & 83 & 63.3428571428571 & 19.6571428571429 \tabularnewline
38 & 62 & 63.3428571428571 & -1.34285714285714 \tabularnewline
39 & 1.6 & 2.36875 & -0.76875 \tabularnewline
40 & 400.2 & 164.511111111111 & 235.688888888889 \tabularnewline
41 & 23.3 & 11.8 & 11.5 \tabularnewline
42 & 4.6 & 11.8 & -7.2 \tabularnewline
43 & 164.6 & 164.511111111111 & 0.0888888888888744 \tabularnewline
44 & 1.9 & 2.36875 & -0.46875 \tabularnewline
45 & 57.5 & 63.3428571428571 & -5.84285714285714 \tabularnewline
46 & 2.4 & 2.36875 & 0.03125 \tabularnewline
47 & 77.3 & 63.3428571428571 & 13.9571428571429 \tabularnewline
48 & 15.8 & 23.7333333333333 & -7.93333333333333 \tabularnewline
49 & 0.6 & 2.36875 & -1.76875 \tabularnewline
50 & 3.5 & 2.36875 & 1.13125 \tabularnewline
51 & 9 & 11.8 & -2.8 \tabularnewline
52 & 62 & 63.3428571428571 & -1.34285714285714 \tabularnewline
53 & 7.4 & 5.5125 & 1.8875 \tabularnewline
54 & 15.6 & 23.7333333333333 & -8.13333333333333 \tabularnewline
55 & 25.2 & 23.7333333333333 & 1.46666666666667 \tabularnewline
56 & 25.4 & 23.7333333333333 & 1.66666666666666 \tabularnewline
57 & 3.5 & 11.8 & -8.3 \tabularnewline
58 & 27.3 & 164.511111111111 & -137.211111111111 \tabularnewline
59 & 37.5 & 63.3428571428571 & -25.8428571428571 \tabularnewline
60 & 3.4 & 5.5125 & -2.1125 \tabularnewline
61 & 14.3 & 11.8 & 2.5 \tabularnewline
62 & 6.1 & 5.5125 & 0.587499999999999 \tabularnewline
63 & 4.9 & 11.8 & -6.9 \tabularnewline
64 & 3.3 & 2.36875 & 0.93125 \tabularnewline
65 & 7 & 5.5125 & 1.4875 \tabularnewline
66 & 8.2 & 5.5125 & 2.6875 \tabularnewline
67 & 43.5 & 23.7333333333333 & 19.7666666666667 \tabularnewline
68 & 48.5 & 63.3428571428571 & -14.8428571428571 \tabularnewline
69 & 5.4 & 5.5125 & -0.1125 \tabularnewline
70 & 49.5 & 63.3428571428571 & -13.8428571428571 \tabularnewline
71 & 29.1 & 23.7333333333333 & 5.36666666666667 \tabularnewline
72 & 2.6 & 11.8 & -9.2 \tabularnewline
73 & 0.8 & 2.36875 & -1.56875 \tabularnewline
74 & 184.8 & 164.511111111111 & 20.2888888888889 \tabularnewline
75 & 2.3 & 23.7333333333333 & -21.4333333333333 \tabularnewline
76 & 8 & 11.8 & -3.8 \tabularnewline
77 & 10.3 & 11.8 & -1.5 \tabularnewline
78 & 50 & 23.7333333333333 & 26.2666666666667 \tabularnewline
79 & 118.1 & 63.3428571428571 & 54.7571428571429 \tabularnewline
\hline
\end{tabular}
%Source: https://freestatistics.org/blog/index.php?pk=198401&T=2

[TABLE]
[ROW][C]Actuals, Predictions, and Residuals[/C][/ROW]
[ROW][C]#[/C][C]Actuals[/C][C]Forecasts[/C][C]Residuals[/C][/ROW]
[ROW][C]1[/C][C]18.2[/C][C]11.8[/C][C]6.4[/C][/ROW]
[ROW][C]2[/C][C]143.8[/C][C]164.511111111111[/C][C]-20.7111111111111[/C][/ROW]
[ROW][C]3[/C][C]23.4[/C][C]63.3428571428571[/C][C]-39.9428571428571[/C][/ROW]
[ROW][C]4[/C][C]1.1[/C][C]2.36875[/C][C]-1.26875[/C][/ROW]
[ROW][C]5[/C][C]49.5[/C][C]63.3428571428571[/C][C]-13.8428571428571[/C][/ROW]
[ROW][C]6[/C][C]4.8[/C][C]11.8[/C][C]-7[/C][/ROW]
[ROW][C]7[/C][C]20.8[/C][C]11.8[/C][C]9[/C][/ROW]
[ROW][C]8[/C][C]19.4[/C][C]11.8[/C][C]7.6[/C][/ROW]
[ROW][C]9[/C][C]2.1[/C][C]2.36875[/C][C]-0.26875[/C][/ROW]
[ROW][C]10[/C][C]79.4[/C][C]164.511111111111[/C][C]-85.1111111111111[/C][/ROW]
[ROW][C]11[/C][C]2.8[/C][C]2.36875[/C][C]0.43125[/C][/ROW]
[ROW][C]12[/C][C]3.8[/C][C]5.5125[/C][C]-1.7125[/C][/ROW]
[ROW][C]13[/C][C]4.1[/C][C]2.36875[/C][C]1.73125[/C][/ROW]
[ROW][C]14[/C][C]13.2[/C][C]11.8[/C][C]1.4[/C][/ROW]
[ROW][C]15[/C][C]2.8[/C][C]5.5125[/C][C]-2.7125[/C][/ROW]
[ROW][C]16[/C][C]48.5[/C][C]164.511111111111[/C][C]-116.011111111111[/C][/ROW]
[ROW][C]17[/C][C]6.2[/C][C]11.8[/C][C]-5.6[/C][/ROW]
[ROW][C]18[/C][C]10.8[/C][C]23.7333333333333[/C][C]-12.9333333333333[/C][/ROW]
[ROW][C]19[/C][C]3.8[/C][C]2.36875[/C][C]1.43125[/C][/ROW]
[ROW][C]20[/C][C]21.9[/C][C]23.7333333333333[/C][C]-1.83333333333334[/C][/ROW]
[ROW][C]21[/C][C]12.6[/C][C]11.8[/C][C]0.799999999999999[/C][/ROW]
[ROW][C]22[/C][C]128[/C][C]164.511111111111[/C][C]-36.5111111111111[/C][/ROW]
[ROW][C]23[/C][C]87.3[/C][C]63.3428571428571[/C][C]23.9571428571429[/C][/ROW]
[ROW][C]24[/C][C]16[/C][C]11.8[/C][C]4.2[/C][/ROW]
[ROW][C]25[/C][C]0.7[/C][C]2.36875[/C][C]-1.66875[/C][/ROW]
[ROW][C]26[/C][C]22.5[/C][C]11.8[/C][C]10.7[/C][/ROW]
[ROW][C]27[/C][C]15.4[/C][C]11.8[/C][C]3.6[/C][/ROW]
[ROW][C]28[/C][C]3[/C][C]2.36875[/C][C]0.63125[/C][/ROW]
[ROW][C]29[/C][C]2.1[/C][C]2.36875[/C][C]-0.26875[/C][/ROW]
[ROW][C]30[/C][C]4.1[/C][C]2.36875[/C][C]1.73125[/C][/ROW]
[ROW][C]31[/C][C]6.4[/C][C]11.8[/C][C]-5.4[/C][/ROW]
[ROW][C]32[/C][C]26.6[/C][C]23.7333333333333[/C][C]2.86666666666667[/C][/ROW]
[ROW][C]33[/C][C]304[/C][C]164.511111111111[/C][C]139.488888888889[/C][/ROW]
[ROW][C]34[/C][C]18.6[/C][C]23.7333333333333[/C][C]-5.13333333333333[/C][/ROW]
[ROW][C]35[/C][C]65[/C][C]63.3428571428571[/C][C]1.65714285714286[/C][/ROW]
[ROW][C]36[/C][C]66.2[/C][C]63.3428571428571[/C][C]2.85714285714286[/C][/ROW]
[ROW][C]37[/C][C]83[/C][C]63.3428571428571[/C][C]19.6571428571429[/C][/ROW]
[ROW][C]38[/C][C]62[/C][C]63.3428571428571[/C][C]-1.34285714285714[/C][/ROW]
[ROW][C]39[/C][C]1.6[/C][C]2.36875[/C][C]-0.76875[/C][/ROW]
[ROW][C]40[/C][C]400.2[/C][C]164.511111111111[/C][C]235.688888888889[/C][/ROW]
[ROW][C]41[/C][C]23.3[/C][C]11.8[/C][C]11.5[/C][/ROW]
[ROW][C]42[/C][C]4.6[/C][C]11.8[/C][C]-7.2[/C][/ROW]
[ROW][C]43[/C][C]164.6[/C][C]164.511111111111[/C][C]0.0888888888888744[/C][/ROW]
[ROW][C]44[/C][C]1.9[/C][C]2.36875[/C][C]-0.46875[/C][/ROW]
[ROW][C]45[/C][C]57.5[/C][C]63.3428571428571[/C][C]-5.84285714285714[/C][/ROW]
[ROW][C]46[/C][C]2.4[/C][C]2.36875[/C][C]0.03125[/C][/ROW]
[ROW][C]47[/C][C]77.3[/C][C]63.3428571428571[/C][C]13.9571428571429[/C][/ROW]
[ROW][C]48[/C][C]15.8[/C][C]23.7333333333333[/C][C]-7.93333333333333[/C][/ROW]
[ROW][C]49[/C][C]0.6[/C][C]2.36875[/C][C]-1.76875[/C][/ROW]
[ROW][C]50[/C][C]3.5[/C][C]2.36875[/C][C]1.13125[/C][/ROW]
[ROW][C]51[/C][C]9[/C][C]11.8[/C][C]-2.8[/C][/ROW]
[ROW][C]52[/C][C]62[/C][C]63.3428571428571[/C][C]-1.34285714285714[/C][/ROW]
[ROW][C]53[/C][C]7.4[/C][C]5.5125[/C][C]1.8875[/C][/ROW]
[ROW][C]54[/C][C]15.6[/C][C]23.7333333333333[/C][C]-8.13333333333333[/C][/ROW]
[ROW][C]55[/C][C]25.2[/C][C]23.7333333333333[/C][C]1.46666666666667[/C][/ROW]
[ROW][C]56[/C][C]25.4[/C][C]23.7333333333333[/C][C]1.66666666666666[/C][/ROW]
[ROW][C]57[/C][C]3.5[/C][C]11.8[/C][C]-8.3[/C][/ROW]
[ROW][C]58[/C][C]27.3[/C][C]164.511111111111[/C][C]-137.211111111111[/C][/ROW]
[ROW][C]59[/C][C]37.5[/C][C]63.3428571428571[/C][C]-25.8428571428571[/C][/ROW]
[ROW][C]60[/C][C]3.4[/C][C]5.5125[/C][C]-2.1125[/C][/ROW]
[ROW][C]61[/C][C]14.3[/C][C]11.8[/C][C]2.5[/C][/ROW]
[ROW][C]62[/C][C]6.1[/C][C]5.5125[/C][C]0.587499999999999[/C][/ROW]
[ROW][C]63[/C][C]4.9[/C][C]11.8[/C][C]-6.9[/C][/ROW]
[ROW][C]64[/C][C]3.3[/C][C]2.36875[/C][C]0.93125[/C][/ROW]
[ROW][C]65[/C][C]7[/C][C]5.5125[/C][C]1.4875[/C][/ROW]
[ROW][C]66[/C][C]8.2[/C][C]5.5125[/C][C]2.6875[/C][/ROW]
[ROW][C]67[/C][C]43.5[/C][C]23.7333333333333[/C][C]19.7666666666667[/C][/ROW]
[ROW][C]68[/C][C]48.5[/C][C]63.3428571428571[/C][C]-14.8428571428571[/C][/ROW]
[ROW][C]69[/C][C]5.4[/C][C]5.5125[/C][C]-0.1125[/C][/ROW]
[ROW][C]70[/C][C]49.5[/C][C]63.3428571428571[/C][C]-13.8428571428571[/C][/ROW]
[ROW][C]71[/C][C]29.1[/C][C]23.7333333333333[/C][C]5.36666666666667[/C][/ROW]
[ROW][C]72[/C][C]2.6[/C][C]11.8[/C][C]-9.2[/C][/ROW]
[ROW][C]73[/C][C]0.8[/C][C]2.36875[/C][C]-1.56875[/C][/ROW]
[ROW][C]74[/C][C]184.8[/C][C]164.511111111111[/C][C]20.2888888888889[/C][/ROW]
[ROW][C]75[/C][C]2.3[/C][C]23.7333333333333[/C][C]-21.4333333333333[/C][/ROW]
[ROW][C]76[/C][C]8[/C][C]11.8[/C][C]-3.8[/C][/ROW]
[ROW][C]77[/C][C]10.3[/C][C]11.8[/C][C]-1.5[/C][/ROW]
[ROW][C]78[/C][C]50[/C][C]23.7333333333333[/C][C]26.2666666666667[/C][/ROW]
[ROW][C]79[/C][C]118.1[/C][C]63.3428571428571[/C][C]54.7571428571429[/C][/ROW]
[/TABLE]
Source: https://freestatistics.org/blog/index.php?pk=198401&T=2

Globally Unique Identifier (entire table): ba.freestatistics.org/blog/index.php?pk=198401&T=2

As an alternative you can also use a QR Code:  

The GUIDs for individual cells are displayed in the table below:

Actuals, Predictions, and Residuals
#ActualsForecastsResiduals
118.211.86.4
2143.8164.511111111111-20.7111111111111
323.463.3428571428571-39.9428571428571
41.12.36875-1.26875
549.563.3428571428571-13.8428571428571
64.811.8-7
720.811.89
819.411.87.6
92.12.36875-0.26875
1079.4164.511111111111-85.1111111111111
112.82.368750.43125
123.85.5125-1.7125
134.12.368751.73125
1413.211.81.4
152.85.5125-2.7125
1648.5164.511111111111-116.011111111111
176.211.8-5.6
1810.823.7333333333333-12.9333333333333
193.82.368751.43125
2021.923.7333333333333-1.83333333333334
2112.611.80.799999999999999
22128164.511111111111-36.5111111111111
2387.363.342857142857123.9571428571429
241611.84.2
250.72.36875-1.66875
2622.511.810.7
2715.411.83.6
2832.368750.63125
292.12.36875-0.26875
304.12.368751.73125
316.411.8-5.4
3226.623.73333333333332.86666666666667
33304164.511111111111139.488888888889
3418.623.7333333333333-5.13333333333333
356563.34285714285711.65714285714286
3666.263.34285714285712.85714285714286
378363.342857142857119.6571428571429
386263.3428571428571-1.34285714285714
391.62.36875-0.76875
40400.2164.511111111111235.688888888889
4123.311.811.5
424.611.8-7.2
43164.6164.5111111111110.0888888888888744
441.92.36875-0.46875
4557.563.3428571428571-5.84285714285714
462.42.368750.03125
4777.363.342857142857113.9571428571429
4815.823.7333333333333-7.93333333333333
490.62.36875-1.76875
503.52.368751.13125
51911.8-2.8
526263.3428571428571-1.34285714285714
537.45.51251.8875
5415.623.7333333333333-8.13333333333333
5525.223.73333333333331.46666666666667
5625.423.73333333333331.66666666666666
573.511.8-8.3
5827.3164.511111111111-137.211111111111
5937.563.3428571428571-25.8428571428571
603.45.5125-2.1125
6114.311.82.5
626.15.51250.587499999999999
634.911.8-6.9
643.32.368750.93125
6575.51251.4875
668.25.51252.6875
6743.523.733333333333319.7666666666667
6848.563.3428571428571-14.8428571428571
695.45.5125-0.1125
7049.563.3428571428571-13.8428571428571
7129.123.73333333333335.36666666666667
722.611.8-9.2
730.82.36875-1.56875
74184.8164.51111111111120.2888888888889
752.323.7333333333333-21.4333333333333
76811.8-3.8
7710.311.8-1.5
785023.733333333333326.2666666666667
79118.163.342857142857154.7571428571429


Parameters (Session):
par1 = 1 ; par2 = none ; par3 = 3 ; par4 = no ;
Parameters (R input):
par1 = 1 ; par2 = none ; par3 = 3 ; par4 = no ;
R code (references can be found in the software module):
library(party)
library(Hmisc)
par1 <- as.numeric(par1)
par3 <- as.numeric(par3)
x <- data.frame(t(y))
is.data.frame(x)
x <- x[!is.na(x[,par1]),]
k <- length(x[1,])
n <- length(x[,1])
colnames(x)[par1]
x[,par1]
if (par2 == 'kmeans') {
cl <- kmeans(x[,par1], par3)
print(cl)
clm <- matrix(cbind(cl$centers,1:par3),ncol=2)
clm <- clm[sort.list(clm[,1]),]
for (i in 1:par3) {
cl$cluster[cl$cluster==clm[i,2]] <- paste('C',i,sep='')
}
cl$cluster <- as.factor(cl$cluster)
print(cl$cluster)
x[,par1] <- cl$cluster
}
if (par2 == 'quantiles') {
x[,par1] <- cut2(x[,par1],g=par3)
}
if (par2 == 'hclust') {
hc <- hclust(dist(x[,par1])^2, 'cen')
print(hc)
memb <- cutree(hc, k = par3)
dum <- c(mean(x[memb==1,par1]))
for (i in 2:par3) {
dum <- c(dum, mean(x[memb==i,par1]))
}
hcm <- matrix(cbind(dum,1:par3),ncol=2)
hcm <- hcm[sort.list(hcm[,1]),]
for (i in 1:par3) {
memb[memb==hcm[i,2]] <- paste('C',i,sep='')
}
memb <- as.factor(memb)
print(memb)
x[,par1] <- memb
}
if (par2=='equal') {
ed <- cut(as.numeric(x[,par1]),par3,labels=paste('C',1:par3,sep=''))
x[,par1] <- as.factor(ed)
}
table(x[,par1])
colnames(x)
colnames(x)[par1]
x[,par1]
if (par2 == 'none') {
m <- ctree(as.formula(paste(colnames(x)[par1],' ~ .',sep='')),data = x)
}
load(file='createtable')
if (par2 != 'none') {
m <- ctree(as.formula(paste('as.factor(',colnames(x)[par1],') ~ .',sep='')),data = x)
if (par4=='yes') {
a<-table.start()
a<-table.row.start(a)
a<-table.element(a,'10-Fold Cross Validation',3+2*par3,TRUE)
a<-table.row.end(a)
a<-table.row.start(a)
a<-table.element(a,'',1,TRUE)
a<-table.element(a,'Prediction (training)',par3+1,TRUE)
a<-table.element(a,'Prediction (testing)',par3+1,TRUE)
a<-table.row.end(a)
a<-table.row.start(a)
a<-table.element(a,'Actual',1,TRUE)
for (jjj in 1:par3) a<-table.element(a,paste('C',jjj,sep=''),1,TRUE)
a<-table.element(a,'CV',1,TRUE)
for (jjj in 1:par3) a<-table.element(a,paste('C',jjj,sep=''),1,TRUE)
a<-table.element(a,'CV',1,TRUE)
a<-table.row.end(a)
for (i in 1:10) {
ind <- sample(2, nrow(x), replace=T, prob=c(0.9,0.1))
m.ct <- ctree(as.formula(paste('as.factor(',colnames(x)[par1],') ~ .',sep='')),data =x[ind==1,])
if (i==1) {
m.ct.i.pred <- predict(m.ct, newdata=x[ind==1,])
m.ct.i.actu <- x[ind==1,par1]
m.ct.x.pred <- predict(m.ct, newdata=x[ind==2,])
m.ct.x.actu <- x[ind==2,par1]
} else {
m.ct.i.pred <- c(m.ct.i.pred,predict(m.ct, newdata=x[ind==1,]))
m.ct.i.actu <- c(m.ct.i.actu,x[ind==1,par1])
m.ct.x.pred <- c(m.ct.x.pred,predict(m.ct, newdata=x[ind==2,]))
m.ct.x.actu <- c(m.ct.x.actu,x[ind==2,par1])
}
}
print(m.ct.i.tab <- table(m.ct.i.actu,m.ct.i.pred))
numer <- 0
for (i in 1:par3) {
print(m.ct.i.tab[i,i] / sum(m.ct.i.tab[i,]))
numer <- numer + m.ct.i.tab[i,i]
}
print(m.ct.i.cp <- numer / sum(m.ct.i.tab))
print(m.ct.x.tab <- table(m.ct.x.actu,m.ct.x.pred))
numer <- 0
for (i in 1:par3) {
print(m.ct.x.tab[i,i] / sum(m.ct.x.tab[i,]))
numer <- numer + m.ct.x.tab[i,i]
}
print(m.ct.x.cp <- numer / sum(m.ct.x.tab))
for (i in 1:par3) {
a<-table.row.start(a)
a<-table.element(a,paste('C',i,sep=''),1,TRUE)
for (jjj in 1:par3) a<-table.element(a,m.ct.i.tab[i,jjj])
a<-table.element(a,round(m.ct.i.tab[i,i]/sum(m.ct.i.tab[i,]),4))
for (jjj in 1:par3) a<-table.element(a,m.ct.x.tab[i,jjj])
a<-table.element(a,round(m.ct.x.tab[i,i]/sum(m.ct.x.tab[i,]),4))
a<-table.row.end(a)
}
a<-table.row.start(a)
a<-table.element(a,'Overall',1,TRUE)
for (jjj in 1:par3) a<-table.element(a,'-')
a<-table.element(a,round(m.ct.i.cp,4))
for (jjj in 1:par3) a<-table.element(a,'-')
a<-table.element(a,round(m.ct.x.cp,4))
a<-table.row.end(a)
a<-table.end(a)
table.save(a,file='mytable3.tab')
}
}
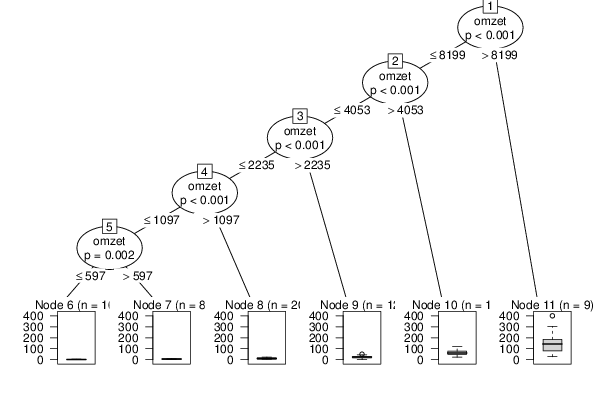
m
bitmap(file='test1.png')
plot(m)
dev.off()
bitmap(file='test1a.png')
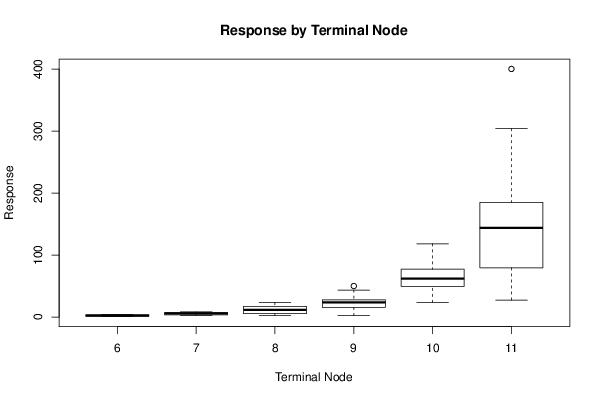
plot(x[,par1] ~ as.factor(where(m)),main='Response by Terminal Node',xlab='Terminal Node',ylab='Response')
dev.off()
if (par2 == 'none') {
forec <- predict(m)
result <- as.data.frame(cbind(x[,par1],forec,x[,par1]-forec))
colnames(result) <- c('Actuals','Forecasts','Residuals')
print(result)
}
if (par2 != 'none') {
print(cbind(as.factor(x[,par1]),predict(m)))
myt <- table(as.factor(x[,par1]),predict(m))
print(myt)
}
bitmap(file='test2.png')
if(par2=='none') {
op <- par(mfrow=c(2,2))
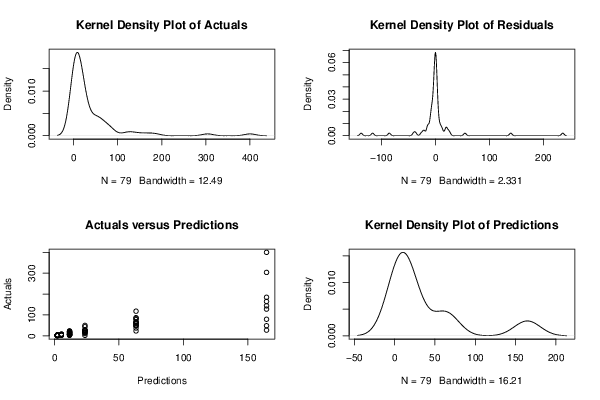
plot(density(result$Actuals),main='Kernel Density Plot of Actuals')
plot(density(result$Residuals),main='Kernel Density Plot of Residuals')
plot(result$Forecasts,result$Actuals,main='Actuals versus Predictions',xlab='Predictions',ylab='Actuals')
plot(density(result$Forecasts),main='Kernel Density Plot of Predictions')
par(op)
}
if(par2!='none') {
plot(myt,main='Confusion Matrix',xlab='Actual',ylab='Predicted')
}
dev.off()
if (par2 == 'none') {
detcoef <- cor(result$Forecasts,result$Actuals)
a<-table.start()
a<-table.row.start(a)
a<-table.element(a,'Goodness of Fit',2,TRUE)
a<-table.row.end(a)
a<-table.row.start(a)
a<-table.element(a,'Correlation',1,TRUE)
a<-table.element(a,round(detcoef,4))
a<-table.row.end(a)
a<-table.row.start(a)
a<-table.element(a,'R-squared',1,TRUE)
a<-table.element(a,round(detcoef*detcoef,4))
a<-table.row.end(a)
a<-table.row.start(a)
a<-table.element(a,'RMSE',1,TRUE)
a<-table.element(a,round(sqrt(mean((result$Residuals)^2)),4))
a<-table.row.end(a)
a<-table.end(a)
table.save(a,file='mytable1.tab')
a<-table.start()
a<-table.row.start(a)
a<-table.element(a,'Actuals, Predictions, and Residuals',4,TRUE)
a<-table.row.end(a)
a<-table.row.start(a)
a<-table.element(a,'#',header=TRUE)
a<-table.element(a,'Actuals',header=TRUE)
a<-table.element(a,'Forecasts',header=TRUE)
a<-table.element(a,'Residuals',header=TRUE)
a<-table.row.end(a)
for (i in 1:length(result$Actuals)) {
a<-table.row.start(a)
a<-table.element(a,i,header=TRUE)
a<-table.element(a,result$Actuals[i])
a<-table.element(a,result$Forecasts[i])
a<-table.element(a,result$Residuals[i])
a<-table.row.end(a)
}
a<-table.end(a)
table.save(a,file='mytable.tab')
}
if (par2 != 'none') {
a<-table.start()
a<-table.row.start(a)
a<-table.element(a,'Confusion Matrix (predicted in columns / actuals in rows)',par3+1,TRUE)
a<-table.row.end(a)
a<-table.row.start(a)
a<-table.element(a,'',1,TRUE)
for (i in 1:par3) {
a<-table.element(a,paste('C',i,sep=''),1,TRUE)
}
a<-table.row.end(a)
for (i in 1:par3) {
a<-table.row.start(a)
a<-table.element(a,paste('C',i,sep=''),1,TRUE)
for (j in 1:par3) {
a<-table.element(a,myt[i,j])
}
a<-table.row.end(a)
}
a<-table.end(a)
table.save(a,file='mytable2.tab')
}