| Multiple Linear Regression - Estimated Regression Equation |
| X1[t] = + 3.78840611306684 + 0.0115218273554624X2[t] + 1.12253997026526X3[t] -0.0380422350614909X4[t] -0.00819222035276419`X5\r`[t] + e[t] |
| Multiple Linear Regression - Ordinary Least Squares | |||||
| Variable | Parameter | S.D. | T-STAT H0: parameter = 0 | 2-tail p-value | 1-tail p-value |
| (Intercept) | 3.78840611306684 | 0.448754 | 8.4421 | 0 | 0 |
| X2 | 0.0115218273554624 | 0.001441 | 7.9983 | 0 | 0 |
| X3 | 1.12253997026526 | 0.783126 | 1.4334 | 0.158091 | 0.079046 |
| X4 | -0.0380422350614909 | 0.377025 | -0.1009 | 0.920041 | 0.46002 |
| `X5\r` | -0.00819222035276419 | 0.006628 | -1.236 | 0.222337 | 0.111168 |
| Multiple Linear Regression - Regression Statistics | |
| Multiple R | 0.84372399458813 |
| R-squared | 0.71187017904375 |
| Adjusted R-squared | 0.688349377333036 |
| F-TEST (value) | 30.265557602974 |
| F-TEST (DF numerator) | 4 |
| F-TEST (DF denominator) | 49 |
| p-value | 1.0609291223318e-12 |
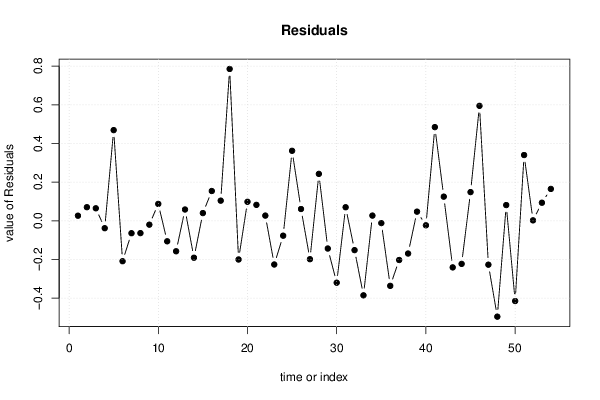
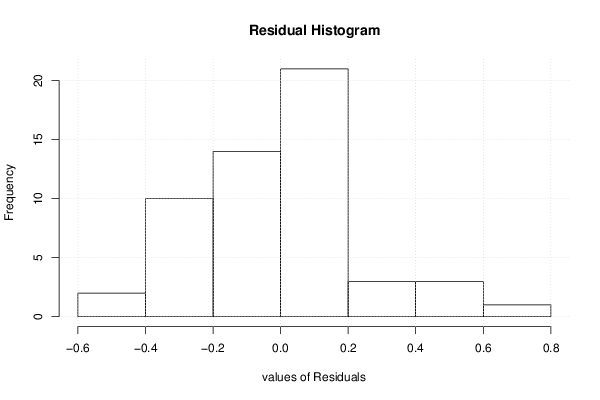
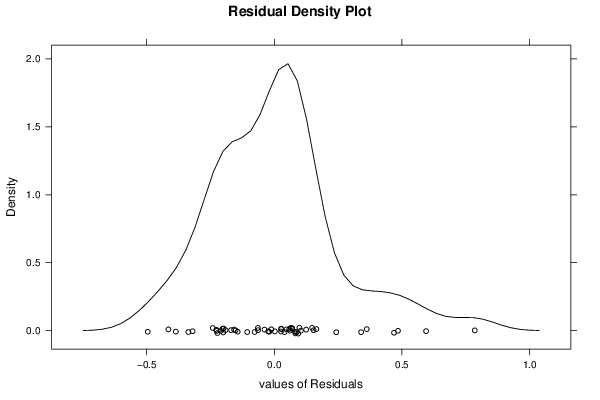
| Multiple Linear Regression - Residual Statistics | |
| Residual Standard Deviation | 0.256180564061598 |
| Sum Squared Residuals | 3.215795588743 |
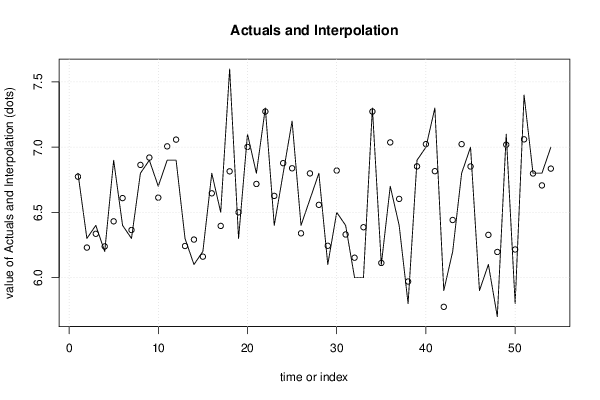
| Multiple Linear Regression - Actuals, Interpolation, and Residuals | |||
| Time or Index | Actuals | Interpolation Forecast | Residuals Prediction Error |
| 1 | 6.8 | 6.77387813022596 | 0.0261218697740364 |
| 2 | 6.3 | 6.22996985779025 | 0.0700301422097456 |
| 3 | 6.4 | 6.33557251670631 | 0.0644274832936906 |
| 4 | 6.2 | 6.23862127673774 | -0.0386212767377413 |
| 5 | 6.9 | 6.43122618381653 | 0.468773816183471 |
| 6 | 6.4 | 6.60936967424624 | -0.209369674246241 |
| 7 | 6.3 | 6.36450858897931 | -0.0645085889793082 |
| 8 | 6.8 | 6.86402212568483 | -0.0640221256848324 |
| 9 | 6.9 | 6.92025506010881 | -0.0202550601088051 |
| 10 | 6.7 | 6.61283123393068 | 0.0871687660693198 |
| 11 | 6.9 | 7.00634436251377 | -0.106344362513765 |
| 12 | 6.9 | 7.05783709672822 | -0.157837096728219 |
| 13 | 6.3 | 6.24191699107448 | 0.0580830089255168 |
| 14 | 6.1 | 6.29128492295706 | -0.19128492295706 |
| 15 | 6.2 | 6.16027760745771 | 0.0397223925422883 |
| 16 | 6.8 | 6.64619544072798 | 0.153804559272017 |
| 17 | 6.5 | 6.39604491928507 | 0.103955080714933 |
| 18 | 7.6 | 6.81479105411077 | 0.785208945889228 |
| 19 | 6.3 | 6.50038214601071 | -0.20038214601071 |
| 20 | 7.1 | 7.00188636291276 | 0.0981136370872348 |
| 21 | 6.8 | 6.71779930959172 | 0.082200690408281 |
| 22 | 7.3 | 7.27337403160029 | 0.0266259683997088 |
| 23 | 6.4 | 6.62626471022892 | -0.226264710228919 |
| 24 | 6.8 | 6.8772269140448 | -0.0772269140448011 |
| 25 | 7.2 | 6.83812975824947 | 0.361870241750534 |
| 26 | 6.4 | 6.33933682242985 | 0.0606631775701504 |
| 27 | 6.6 | 6.79884460642695 | -0.19884460642695 |
| 28 | 6.8 | 6.5575822748055 | 0.242417725194502 |
| 29 | 6.1 | 6.24371174095154 | -0.14371174095154 |
| 30 | 6.5 | 6.82049636258336 | -0.320496362583363 |
| 31 | 6.4 | 6.33019805927449 | 0.0698019407255132 |
| 32 | 6 | 6.15204598271565 | -0.152045982715655 |
| 33 | 6 | 6.38581587114722 | -0.385815871147223 |
| 34 | 7.3 | 7.27337403160029 | 0.0266259683997088 |
| 35 | 6.1 | 6.11203968385084 | -0.0120396838508399 |
| 36 | 6.7 | 7.03668387018126 | -0.336683870181263 |
| 37 | 6.4 | 6.60305894684141 | -0.20305894684141 |
| 38 | 5.8 | 5.96957279939882 | -0.169572799398816 |
| 39 | 6.9 | 6.85290423460732 | 0.0470957653926849 |
| 40 | 7 | 7.02359602384999 | -0.0235960238499904 |
| 41 | 7.3 | 6.81574803382076 | 0.484251966179236 |
| 42 | 5.9 | 5.77532853544889 | 0.124671464551114 |
| 43 | 6.2 | 6.44132058929693 | -0.241320589296927 |
| 44 | 6.8 | 7.02313715128798 | -0.223137151287981 |
| 45 | 7 | 6.85187050871508 | 0.148129491284916 |
| 46 | 5.9 | 5.3056383564474 | 0.594361643552602 |
| 47 | 6.1 | 6.32728276728836 | -0.227282767288361 |
| 48 | 5.7 | 6.19608917499678 | -0.496089174996776 |
| 49 | 7.1 | 7.01888404262818 | 0.0811159573718166 |
| 50 | 5.8 | 6.21526227959802 | -0.415262279598021 |
| 51 | 7.4 | 7.06007170561105 | 0.339928294388953 |
| 52 | 6.8 | 6.7979771331381 | 0.0020228668619019 |
| 53 | 6.8 | 6.70668167117236 | 0.0933183288276435 |
| 54 | 7 | 6.83543646416523 | 0.164563535834768 |
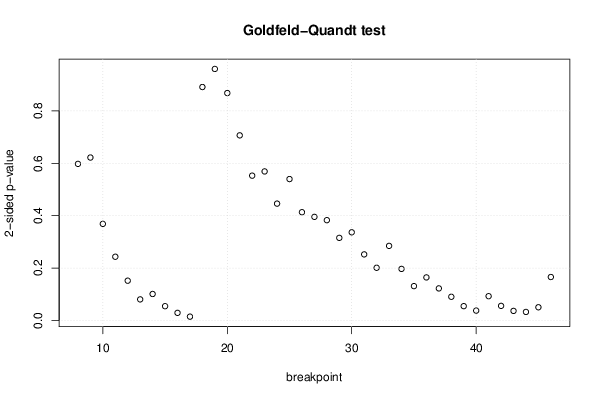
| Goldfeld-Quandt test for Heteroskedasticity | |||
| p-values | Alternative Hypothesis | ||
| breakpoint index | greater | 2-sided | less |
| 8 | 0.298835572381041 | 0.597671144762082 | 0.701164427618959 |
| 9 | 0.310980189661388 | 0.621960379322776 | 0.689019810338612 |
| 10 | 0.184277409392748 | 0.368554818785496 | 0.815722590607252 |
| 11 | 0.12152781639281 | 0.24305563278562 | 0.87847218360719 |
| 12 | 0.0757649892166197 | 0.151529978433239 | 0.92423501078338 |
| 13 | 0.0400891255804423 | 0.0801782511608846 | 0.959910874419558 |
| 14 | 0.0503932783614803 | 0.100786556722961 | 0.94960672163852 |
| 15 | 0.0271021677597761 | 0.0542043355195523 | 0.972897832240224 |
| 16 | 0.0143975786319957 | 0.0287951572639915 | 0.985602421368004 |
| 17 | 0.00712695340333373 | 0.0142539068066675 | 0.992873046596666 |
| 18 | 0.554378620123371 | 0.891242759753259 | 0.445621379876629 |
| 19 | 0.519853133219558 | 0.960293733560884 | 0.480146866780442 |
| 20 | 0.434075521002937 | 0.868151042005873 | 0.565924478997063 |
| 21 | 0.353339666523789 | 0.706679333047577 | 0.646660333476211 |
| 22 | 0.27637423738274 | 0.552748474765481 | 0.72362576261726 |
| 23 | 0.284443984991086 | 0.568887969982173 | 0.715556015008914 |
| 24 | 0.222953399390374 | 0.445906798780748 | 0.777046600609626 |
| 25 | 0.269881591298047 | 0.539763182596094 | 0.730118408701953 |
| 26 | 0.206577780622736 | 0.413155561245472 | 0.793422219377264 |
| 27 | 0.197699479304393 | 0.395398958608786 | 0.802300520695607 |
| 28 | 0.191362525418138 | 0.382725050836277 | 0.808637474581862 |
| 29 | 0.157571048757461 | 0.315142097514921 | 0.842428951242539 |
| 30 | 0.168225289065994 | 0.336450578131987 | 0.831774710934006 |
| 31 | 0.126026820485123 | 0.252053640970245 | 0.873973179514877 |
| 32 | 0.100467840406922 | 0.200935680813844 | 0.899532159593078 |
| 33 | 0.142233541654074 | 0.284467083308148 | 0.857766458345926 |
| 34 | 0.098294412855655 | 0.19658882571131 | 0.901705587144345 |
| 35 | 0.0654547498720778 | 0.130909499744156 | 0.934545250127922 |
| 36 | 0.0820581087618944 | 0.164116217523789 | 0.917941891238106 |
| 37 | 0.0610713039559149 | 0.12214260791183 | 0.938928696044085 |
| 38 | 0.0450965734923729 | 0.0901931469847458 | 0.954903426507627 |
| 39 | 0.0271673557490538 | 0.0543347114981077 | 0.972832644250946 |
| 40 | 0.018686534079436 | 0.037373068158872 | 0.981313465920564 |
| 41 | 0.0461763568055887 | 0.0923527136111775 | 0.953823643194411 |
| 42 | 0.0276911801271985 | 0.055382360254397 | 0.972308819872801 |
| 43 | 0.0181125344383768 | 0.0362250688767536 | 0.981887465561623 |
| 44 | 0.0161113585101868 | 0.0322227170203736 | 0.983888641489813 |
| 45 | 0.0250544000310359 | 0.0501088000620717 | 0.974945599968964 |
| 46 | 0.917170041142346 | 0.165659917715309 | 0.0828299588576545 |
| Meta Analysis of Goldfeld-Quandt test for Heteroskedasticity | |||
| Description | # significant tests | % significant tests | OK/NOK |
| 1% type I error level | 0 | 0 | OK |
| 5% type I error level | 5 | 0.128205128205128 | NOK |
| 10% type I error level | 12 | 0.307692307692308 | NOK |