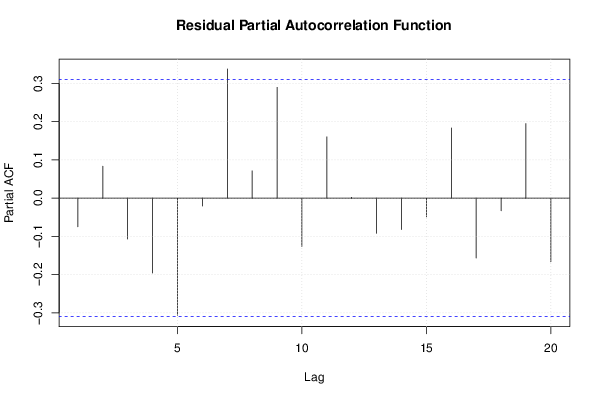
| Multiple Linear Regression - Estimated Regression Equation |
| IQ[t] = + 110.100178890877 -7.37805605247466geslacht[t] + 4.15123159488097gewest1[t] -1.90693087473052gewest2[t] + e[t] |
| Multiple Linear Regression - Ordinary Least Squares | |||||
| Variable | Parameter | S.D. | T-STAT H0: parameter = 0 | 2-tail p-value | 1-tail p-value |
| (Intercept) | 110.100178890877 | 5.531868 | 19.9029 | 0 | 0 |
| geslacht | -7.37805605247466 | 5.344292 | -1.3805 | 0.17593 | 0.087965 |
| gewest1 | 4.15123159488097 | 6.32307 | 0.6565 | 0.515664 | 0.257832 |
| gewest2 | -1.90693087473052 | 6.500052 | -0.2934 | 0.770923 | 0.385461 |
| Multiple Linear Regression - Regression Statistics | |
| Multiple R | 0.269587985712588 |
| R-squared | 0.0726776820405704 |
| Adjusted R-squared | -0.0045991777893819 |
| F-TEST (value) | 0.940484411510735 |
| F-TEST (DF numerator) | 3 |
| F-TEST (DF denominator) | 36 |
| p-value | 0.431227672104281 |
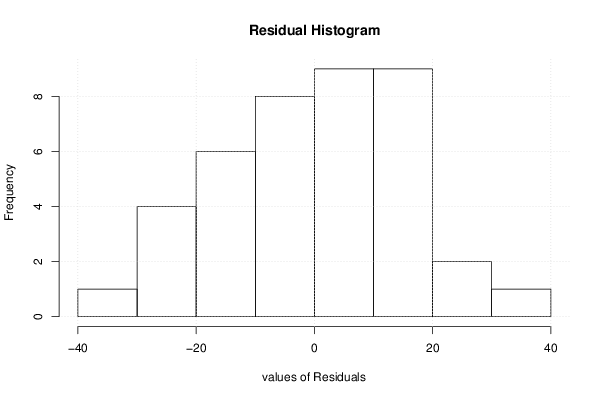
| Multiple Linear Regression - Residual Statistics | |
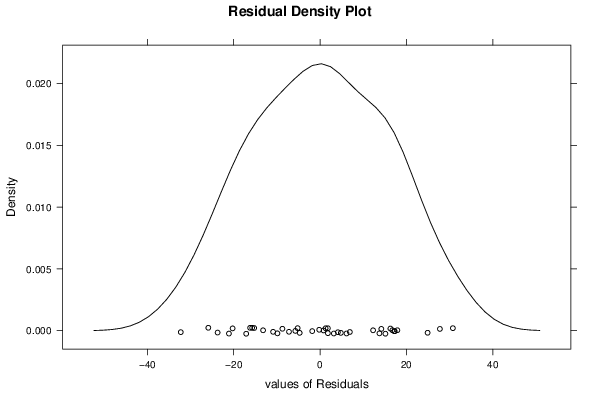
| Residual Standard Deviation | 16.2226209307576 |
| Sum Squared Residuals | 9474.24347506995 |
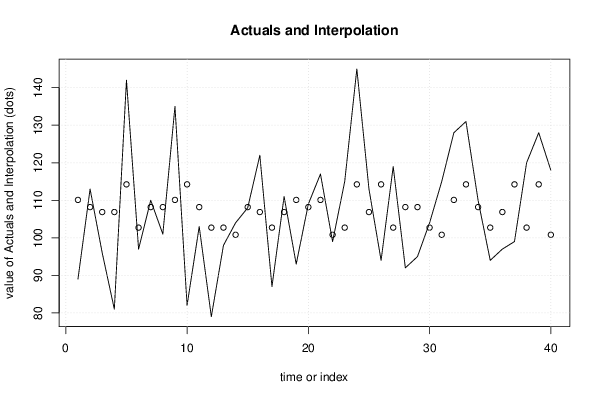
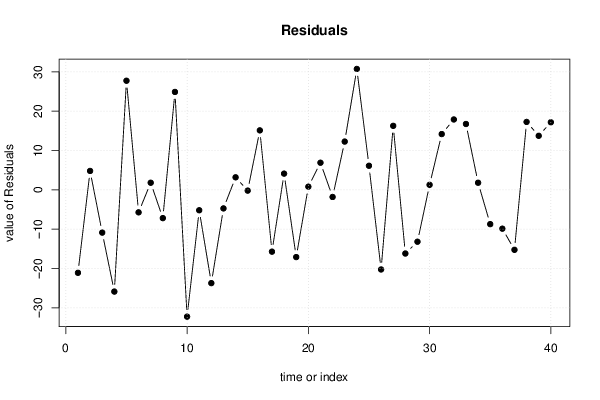
| Multiple Linear Regression - Actuals, Interpolation, and Residuals | |||
| Time or Index | Actuals | Interpolation Forecast | Residuals Prediction Error |
| 1 | 89 | 110.100178890877 | -21.1001788908765 |
| 2 | 113 | 108.193248016146 | 4.80675198385394 |
| 3 | 96 | 106.873354433283 | -10.8733544332829 |
| 4 | 81 | 106.873354433283 | -25.8733544332829 |
| 5 | 142 | 114.251410485758 | 27.7485895142425 |
| 6 | 97 | 102.722122838402 | -5.72212283840191 |
| 7 | 110 | 108.193248016146 | 1.80675198385395 |
| 8 | 101 | 108.193248016146 | -7.19324801614605 |
| 9 | 135 | 110.100178890877 | 24.8998211091234 |
| 10 | 82 | 114.251410485758 | -32.2514104857575 |
| 11 | 103 | 108.193248016146 | -5.19324801614605 |
| 12 | 79 | 102.722122838402 | -23.7221228384019 |
| 13 | 98 | 102.722122838402 | -4.72212283840191 |
| 14 | 104 | 100.815191963671 | 3.18480803632861 |
| 15 | 108 | 108.193248016146 | -0.19324801614605 |
| 16 | 122 | 106.873354433283 | 15.1266455667171 |
| 17 | 87 | 102.722122838402 | -15.7221228384019 |
| 18 | 111 | 106.873354433283 | 4.12664556671713 |
| 19 | 93 | 110.100178890877 | -17.1001788908766 |
| 20 | 109 | 108.193248016146 | 0.80675198385395 |
| 21 | 117 | 110.100178890877 | 6.89982110912343 |
| 22 | 99 | 100.815191963671 | -1.81519196367139 |
| 23 | 115 | 102.722122838402 | 12.2778771615981 |
| 24 | 145 | 114.251410485758 | 30.7485895142425 |
| 25 | 113 | 106.873354433283 | 6.12664556671712 |
| 26 | 94 | 114.251410485758 | -20.2514104857575 |
| 27 | 119 | 102.722122838402 | 16.2778771615981 |
| 28 | 92 | 108.193248016146 | -16.193248016146 |
| 29 | 95 | 108.193248016146 | -13.193248016146 |
| 30 | 104 | 102.722122838402 | 1.27787716159809 |
| 31 | 115 | 100.815191963671 | 14.1848080363286 |
| 32 | 128 | 110.100178890877 | 17.8998211091234 |
| 33 | 131 | 114.251410485758 | 16.7485895142425 |
| 34 | 110 | 108.193248016146 | 1.80675198385395 |
| 35 | 94 | 102.722122838402 | -8.72212283840191 |
| 36 | 97 | 106.873354433283 | -9.87335443328288 |
| 37 | 99 | 114.251410485758 | -15.2514104857575 |
| 38 | 120 | 102.722122838402 | 17.2778771615981 |
| 39 | 128 | 114.251410485758 | 13.7485895142425 |
| 40 | 118 | 100.815191963671 | 17.1848080363286 |
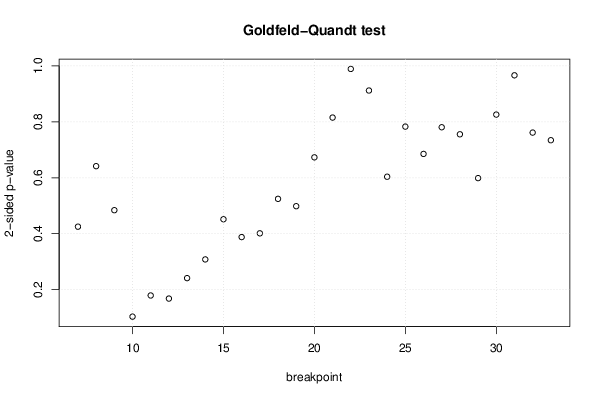
| Goldfeld-Quandt test for Heteroskedasticity | |||
| p-values | Alternative Hypothesis | ||
| breakpoint index | greater | 2-sided | less |
| 7 | 0.787489098676916 | 0.425021802646167 | 0.212510901323084 |
| 8 | 0.6792864591715 | 0.641427081657 | 0.3207135408285 |
| 9 | 0.758010051654657 | 0.483979896690686 | 0.241989948345343 |
| 10 | 0.948393890810464 | 0.103212218379072 | 0.0516061091895358 |
| 11 | 0.910530727099398 | 0.178938545801204 | 0.0894692729006018 |
| 12 | 0.916061348168703 | 0.167877303662595 | 0.0839386518312973 |
| 13 | 0.879482336216214 | 0.241035327567572 | 0.120517663783786 |
| 14 | 0.846034591743529 | 0.307930816512942 | 0.153965408256471 |
| 15 | 0.77419882054802 | 0.451602358903959 | 0.22580117945198 |
| 16 | 0.806118353055958 | 0.387763293888084 | 0.193881646944042 |
| 17 | 0.799365664385375 | 0.401268671229249 | 0.200634335614625 |
| 18 | 0.73774549983275 | 0.5245090003345 | 0.26225450016725 |
| 19 | 0.750862708935172 | 0.498274582129656 | 0.249137291064828 |
| 20 | 0.663511213200162 | 0.672977573599676 | 0.336488786799838 |
| 21 | 0.592348476613506 | 0.815303046772989 | 0.407651523386494 |
| 22 | 0.494588907722988 | 0.989177815445976 | 0.505411092277012 |
| 23 | 0.456002576684539 | 0.912005153369077 | 0.543997423315461 |
| 24 | 0.698169109711329 | 0.603661780577342 | 0.301830890288671 |
| 25 | 0.608521263514747 | 0.782957472970505 | 0.391478736485253 |
| 26 | 0.657371927386998 | 0.685256145226004 | 0.342628072613002 |
| 27 | 0.609671382410813 | 0.780657235178373 | 0.390328617589187 |
| 28 | 0.622257160377382 | 0.755485679245236 | 0.377742839622618 |
| 29 | 0.700636126242167 | 0.598727747515665 | 0.299363873757833 |
| 30 | 0.587017660537124 | 0.825964678925751 | 0.412982339462876 |
| 31 | 0.483222688254578 | 0.966445376509156 | 0.516777311745422 |
| 32 | 0.38078086726145 | 0.7615617345229 | 0.61921913273855 |
| 33 | 0.367138671723468 | 0.734277343446937 | 0.632861328276532 |
| Meta Analysis of Goldfeld-Quandt test for Heteroskedasticity | |||
| Description | # significant tests | % significant tests | OK/NOK |
| 1% type I error level | 0 | 0 | OK |
| 5% type I error level | 0 | 0 | OK |
| 10% type I error level | 0 | 0 | OK |