| Multiple Linear Regression - Estimated Regression Equation |
| time_in_rfc[t] = + 12038.8016502968 + 97.5747716715336logins[t] + 121.465541973317compendium_views_info[t] + 36.9983802735949compendium_views_pr[t] -545.192912437675shared_compendiums[t] + 877.081179790895blogged_computations[t] + 759.614741830864compendiums_reviewed[t] + e[t] |
| Multiple Linear Regression - Ordinary Least Squares | |||||
| Variable | Parameter | S.D. | T-STAT H0: parameter = 0 | 2-tail p-value | 1-tail p-value |
| (Intercept) | 12038.8016502968 | 17490.871206 | 0.6883 | 0.494451 | 0.247225 |
| logins | 97.5747716715336 | 267.119437 | 0.3653 | 0.716439 | 0.35822 |
| compendium_views_info | 121.465541973317 | 28.679905 | 4.2352 | 9.8e-05 | 4.9e-05 |
| compendium_views_pr | 36.9983802735949 | 69.611109 | 0.5315 | 0.597425 | 0.298713 |
| shared_compendiums | -545.192912437675 | 1882.3068 | -0.2896 | 0.773289 | 0.386644 |
| blogged_computations | 877.081179790895 | 260.283428 | 3.3697 | 0.001457 | 0.000728 |
| compendiums_reviewed | 759.614741830864 | 817.364656 | 0.9293 | 0.357175 | 0.178587 |
| Multiple Linear Regression - Regression Statistics | |
| Multiple R | 0.902716839504998 |
| R-squared | 0.814897692325893 |
| Adjusted R-squared | 0.792685415405 |
| F-TEST (value) | 36.6868149189785 |
| F-TEST (DF numerator) | 6 |
| F-TEST (DF denominator) | 50 |
| p-value | 1.11022302462516e-16 |
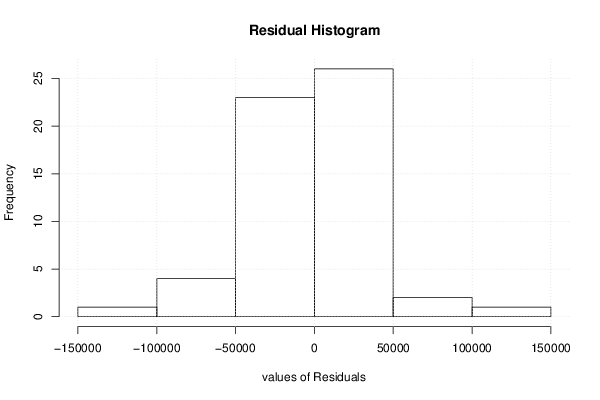
| Multiple Linear Regression - Residual Statistics | |
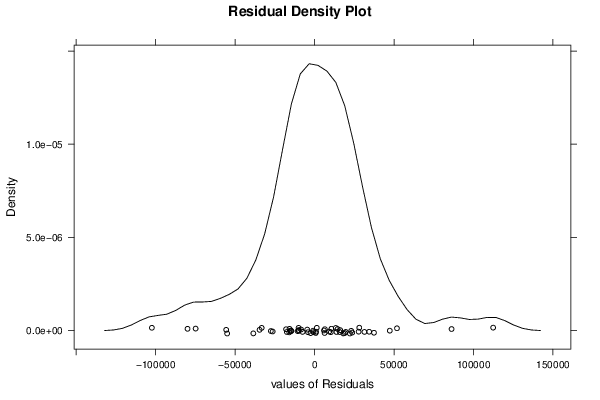
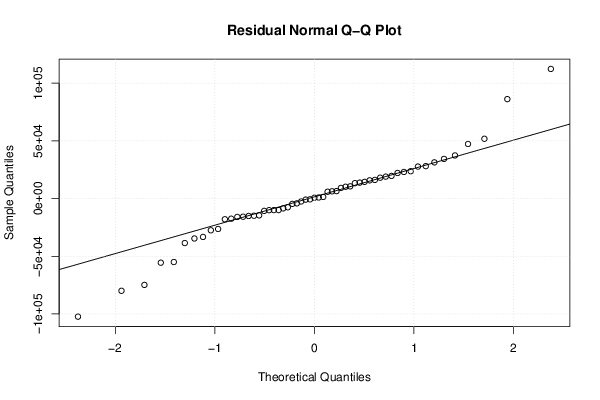
| Residual Standard Deviation | 37540.5425793336 |
| Sum Squared Residuals | 70464616857.538 |
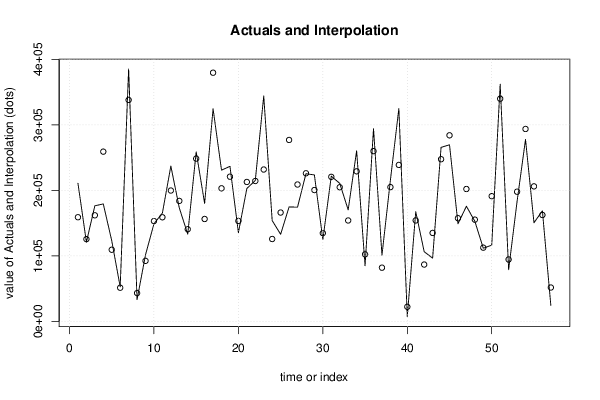
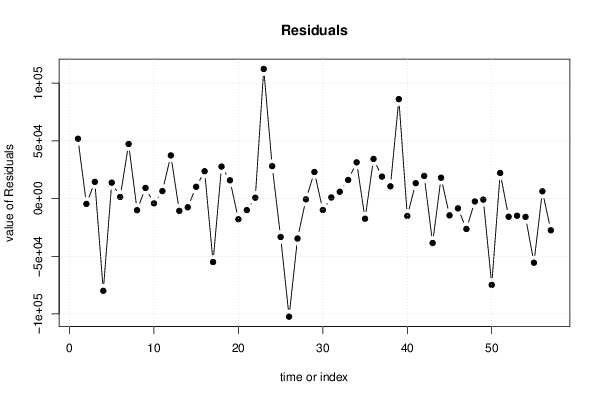
| Multiple Linear Regression - Actuals, Interpolation, and Residuals | |||
| Time or Index | Actuals | Interpolation Forecast | Residuals Prediction Error |
| 1 | 210907 | 159042.489008591 | 51864.510991409 |
| 2 | 120982 | 125572.315294411 | -4590.3152944109 |
| 3 | 176508 | 162004.912325098 | 14503.0876749021 |
| 4 | 179321 | 259227.756798927 | -79906.7567989273 |
| 5 | 123185 | 109360.733278493 | 13824.2667215073 |
| 6 | 52746 | 51331.0880646819 | 1414.91193531813 |
| 7 | 385534 | 338192.946464105 | 47341.0535358949 |
| 8 | 33170 | 43212.9668802606 | -10042.9668802606 |
| 9 | 101645 | 92402.9715577377 | 9242.02844226228 |
| 10 | 149061 | 153193.88969282 | -4132.88969281995 |
| 11 | 165446 | 158945.538690761 | 6500.46130923942 |
| 12 | 237213 | 199810.584816737 | 37402.4151832632 |
| 13 | 173326 | 183955.458923902 | -10629.4589239015 |
| 14 | 133131 | 140662.403181111 | -7531.40318111099 |
| 15 | 258873 | 248611.603695225 | 10261.3963047748 |
| 16 | 180083 | 156355.331968343 | 23727.6680316574 |
| 17 | 324799 | 379766.379103956 | -54967.3791039562 |
| 18 | 230964 | 203208.057532169 | 27755.9424678309 |
| 19 | 236785 | 220940.500909991 | 15844.4990900093 |
| 20 | 135473 | 153379.344922275 | -17906.344922275 |
| 21 | 202925 | 212883.869747969 | -9958.8697479695 |
| 22 | 215147 | 214390.811916242 | 756.188083757706 |
| 23 | 344297 | 231919.830875255 | 112377.169124745 |
| 24 | 153935 | 125792.427089287 | 28142.5729107132 |
| 25 | 132943 | 166198.946206882 | -33255.9462068821 |
| 26 | 174724 | 277054.061863767 | -102330.061863767 |
| 27 | 174415 | 208996.059016806 | -34581.0590168055 |
| 28 | 225548 | 226176.976317499 | -628.976317499294 |
| 29 | 223632 | 200558.30914732 | 23073.6908526803 |
| 30 | 124817 | 134750.244430626 | -9933.24443062558 |
| 31 | 221698 | 220732.25887267 | 965.741127330058 |
| 32 | 210767 | 204835.136397213 | 5931.8636027869 |
| 33 | 170266 | 154088.003627574 | 16177.9963724262 |
| 34 | 260561 | 229154.290994569 | 31406.7090054311 |
| 35 | 84853 | 102288.224639328 | -17435.2246393279 |
| 36 | 294424 | 260053.368035846 | 34370.6319641538 |
| 37 | 101011 | 81969.5035055238 | 19041.4964944762 |
| 38 | 215641 | 205019.37822398 | 10621.6217760202 |
| 39 | 325107 | 238900.763020633 | 86206.2369793672 |
| 40 | 7176 | 22237.1590871186 | -15061.1590871186 |
| 41 | 167542 | 154171.287351283 | 13370.7126487166 |
| 42 | 106408 | 86764.1262885542 | 19643.8737114458 |
| 43 | 96560 | 135075.303127548 | -38515.3031275478 |
| 44 | 265769 | 247669.294967367 | 18099.7050326333 |
| 45 | 269651 | 284170.152093294 | -14519.1520932941 |
| 46 | 149112 | 157566.784179102 | -8454.7841791018 |
| 47 | 175824 | 202157.694188842 | -26333.6941888422 |
| 48 | 152871 | 155346.724694035 | -2475.72469403496 |
| 49 | 111665 | 112554.475536056 | -889.475536055782 |
| 50 | 116408 | 191208.649286415 | -74800.6492864148 |
| 51 | 362301 | 340094.887562685 | 22206.1124373153 |
| 52 | 78800 | 94530.6996458357 | -15730.6996458357 |
| 53 | 183167 | 198016.298850188 | -14849.2988501879 |
| 54 | 277965 | 293858.960390487 | -15893.9603904868 |
| 55 | 150629 | 206198.113224204 | -55569.1132242044 |
| 56 | 168809 | 162492.492156685 | 6316.5078433155 |
| 57 | 24188 | 51655.1603317191 | -27467.1603317192 |
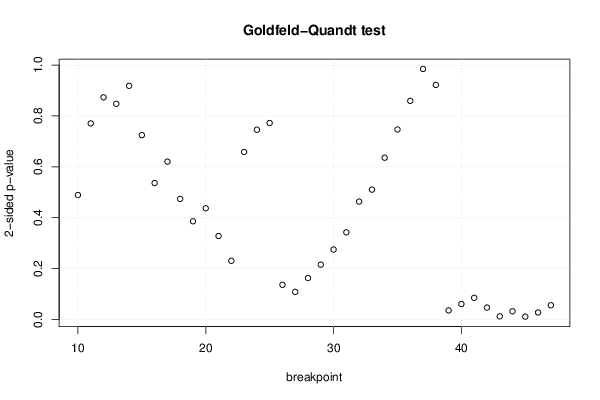
| Goldfeld-Quandt test for Heteroskedasticity | |||
| p-values | Alternative Hypothesis | ||
| breakpoint index | greater | 2-sided | less |
| 10 | 0.755525319926467 | 0.488949360147066 | 0.244474680073533 |
| 11 | 0.614662363555903 | 0.770675272888193 | 0.385337636444097 |
| 12 | 0.563336627259861 | 0.873326745480278 | 0.436663372740139 |
| 13 | 0.576036067128462 | 0.847927865743075 | 0.423963932871538 |
| 14 | 0.459340470229491 | 0.918680940458982 | 0.540659529770509 |
| 15 | 0.362232258562407 | 0.724464517124814 | 0.637767741437593 |
| 16 | 0.267973478393248 | 0.535946956786496 | 0.732026521606752 |
| 17 | 0.310147285290193 | 0.620294570580387 | 0.689852714709807 |
| 18 | 0.236853346640282 | 0.473706693280564 | 0.763146653359718 |
| 19 | 0.192895998968913 | 0.385791997937826 | 0.807104001031087 |
| 20 | 0.218432488867619 | 0.436864977735237 | 0.781567511132381 |
| 21 | 0.163843727337654 | 0.327687454675308 | 0.836156272662346 |
| 22 | 0.115040073894779 | 0.230080147789559 | 0.884959926105221 |
| 23 | 0.670817094806516 | 0.658365810386969 | 0.329182905193485 |
| 24 | 0.627087760378593 | 0.745824479242813 | 0.372912239621407 |
| 25 | 0.613834857638906 | 0.772330284722188 | 0.386165142361094 |
| 26 | 0.932117535633139 | 0.135764928733721 | 0.0678824643668607 |
| 27 | 0.946056048210783 | 0.107887903578435 | 0.0539439517892174 |
| 28 | 0.918823022510523 | 0.162353954978955 | 0.0811769774894774 |
| 29 | 0.892493414378956 | 0.215013171242088 | 0.107506585621044 |
| 30 | 0.862780906175123 | 0.274438187649754 | 0.137219093824877 |
| 31 | 0.828957929865463 | 0.342084140269075 | 0.171042070134537 |
| 32 | 0.768409869738037 | 0.463180260523925 | 0.231590130261963 |
| 33 | 0.744879554925297 | 0.510240890149406 | 0.255120445074703 |
| 34 | 0.682092404805241 | 0.635815190389518 | 0.317907595194759 |
| 35 | 0.626597602759833 | 0.746804794480334 | 0.373402397240167 |
| 36 | 0.570270120238867 | 0.859459759522266 | 0.429729879761133 |
| 37 | 0.507502897711644 | 0.984994204576711 | 0.492497102288355 |
| 38 | 0.461121246633853 | 0.922242493267706 | 0.538878753366147 |
| 39 | 0.982578137730276 | 0.0348437245394481 | 0.017421862269724 |
| 40 | 0.969983630868712 | 0.0600327382625765 | 0.0300163691312882 |
| 41 | 0.957734831709689 | 0.0845303365806216 | 0.0422651682903108 |
| 42 | 0.976929274286216 | 0.0461414514275682 | 0.0230707257137841 |
| 43 | 0.994246329095401 | 0.0115073418091977 | 0.00575367090459886 |
| 44 | 0.984230217340724 | 0.0315395653185521 | 0.0157697826592761 |
| 45 | 0.994802821617008 | 0.010394356765985 | 0.00519717838299252 |
| 46 | 0.986581771614445 | 0.026836456771109 | 0.0134182283855545 |
| 47 | 0.972387501687148 | 0.055224996625704 | 0.027612498312852 |
| Meta Analysis of Goldfeld-Quandt test for Heteroskedasticity | |||
| Description | # significant tests | % significant tests | OK/NOK |
| 1% type I error level | 0 | 0 | OK |
| 5% type I error level | 6 | 0.157894736842105 | NOK |
| 10% type I error level | 9 | 0.236842105263158 | NOK |