| Multiple Linear Regression - Estimated Regression Equation |
| 2011-III[t] = -18.9779124693251 + 2.48119079055184`2010-I`[t] + 0.135764318755094`2010-II`[t] -1.20369075650056`2010-III`[t] + 0.450866640842221`2010-IV`[t] + 2.24822610044223`2011-I`[t] -0.846583834938722`2011-II`[t] -1.99524909389644`2011-IV`[t] + e[t] |
| Multiple Linear Regression - Ordinary Least Squares | |||||
| Variable | Parameter | S.D. | T-STAT H0: parameter = 0 | 2-tail p-value | 1-tail p-value |
| (Intercept) | -18.9779124693251 | 141.289693 | -0.1343 | 0.893592 | 0.446796 |
| `2010-I` | 2.48119079055184 | 0.603171 | 4.1136 | 0.000119 | 5.9e-05 |
| `2010-II` | 0.135764318755094 | 0.388449 | 0.3495 | 0.727915 | 0.363958 |
| `2010-III` | -1.20369075650056 | 1.160068 | -1.0376 | 0.30355 | 0.151775 |
| `2010-IV` | 0.450866640842221 | 0.395617 | 1.1397 | 0.258885 | 0.129443 |
| `2011-I` | 2.24822610044223 | 0.47135 | 4.7698 | 1.2e-05 | 6e-06 |
| `2011-II` | -0.846583834938722 | 0.568112 | -1.4902 | 0.141332 | 0.070666 |
| `2011-IV` | -1.99524909389644 | 0.190183 | -10.4912 | 0 | 0 |
| Multiple Linear Regression - Regression Statistics | |
| Multiple R | 0.994547797361699 |
| R-squared | 0.989125321237006 |
| Adjusted R-squared | 0.987877407280597 |
| F-TEST (value) | 792.623013916146 |
| F-TEST (DF numerator) | 7 |
| F-TEST (DF denominator) | 61 |
| p-value | 0 |
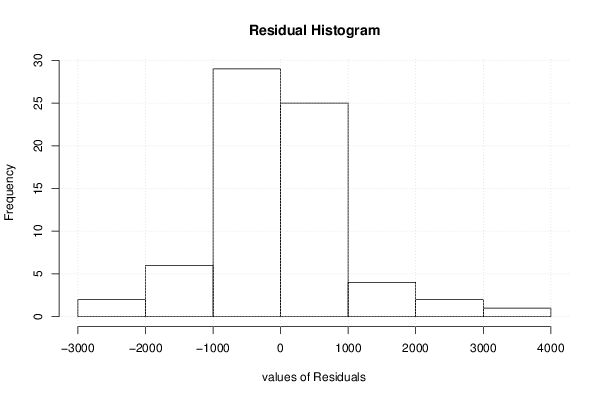
| Multiple Linear Regression - Residual Statistics | |
| Residual Standard Deviation | 1039.2738924807 |
| Sum Squared Residuals | 65885503.6391114 |
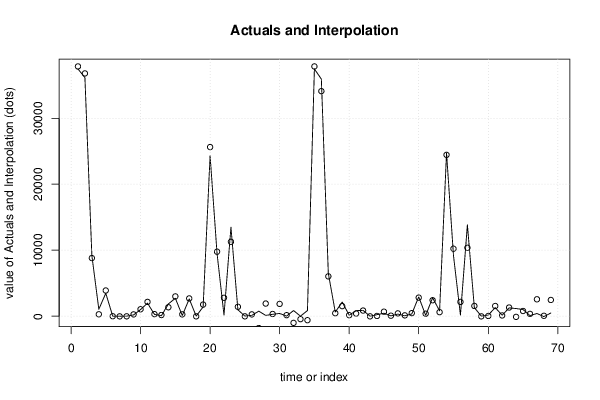
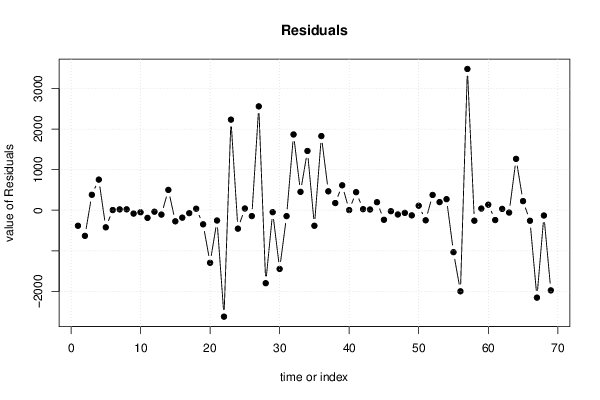
| Multiple Linear Regression - Actuals, Interpolation, and Residuals | |||
| Time or Index | Actuals | Interpolation Forecast | Residuals Prediction Error |
| 1 | 37471 | 37852.9966997555 | -381.996699755488 |
| 2 | 36160 | 36791.2972160254 | -631.297216025446 |
| 3 | 9197 | 8816.01944150986 | 380.980558490143 |
| 4 | 1051 | 296.127887014367 | 754.872112985633 |
| 5 | 3480 | 3900.89447299056 | -420.894472990558 |
| 6 | 4 | -0.822662349069608 | 4.82266234906961 |
| 7 | 1 | -19.7026373979662 | 20.7026373979662 |
| 8 | 10 | -12.5289676569318 | 22.5289676569318 |
| 9 | 196 | 277.996507657913 | -81.9965076579127 |
| 10 | 1007 | 1056.84302826805 | -49.843028268055 |
| 11 | 1982 | 2168.91451346588 | -186.914513465882 |
| 12 | 281 | 317.162177934359 | -36.1621779343592 |
| 13 | 76 | 182.97532710569 | -106.97532710569 |
| 14 | 1861 | 1359.58800719926 | 501.411992800739 |
| 15 | 2729 | 3001.98230030246 | -272.982300302456 |
| 16 | 102 | 284.862679728689 | -182.862679728689 |
| 17 | 2627 | 2698.14170810444 | -71.1417081044412 |
| 18 | 21 | -16.6706857354468 | 37.6706857354468 |
| 19 | 1421 | 1768.33858662678 | -347.338586626784 |
| 20 | 24339 | 25633.2326258938 | -1294.23262589383 |
| 21 | 9522 | 9774.99616784028 | -252.99616784028 |
| 22 | 171 | 2792.83178448692 | -2621.83178448692 |
| 23 | 13508 | 11275.9731369393 | 2232.02686306071 |
| 24 | 975 | 1428.5168594408 | -453.516859440798 |
| 25 | 27 | -15.8531319409452 | 42.8531319409452 |
| 26 | 137 | 280.538791705606 | -143.538791705606 |
| 27 | 768 | -1791.11739099243 | 2559.11739099243 |
| 28 | 122 | 1919.83270991248 | -1797.83270991248 |
| 29 | 292 | 339.505455114736 | -47.5054551147363 |
| 30 | 423 | 1868.36432902682 | -1445.36432902682 |
| 31 | 16 | 161.214467264217 | -145.214467264217 |
| 32 | 860 | -1006.77223570197 | 1866.77223570197 |
| 33 | 12 | -441.077688315756 | 453.077688315756 |
| 34 | 860 | -600.069330827994 | 1460.06933082799 |
| 35 | 37471 | 37852.9966997555 | -381.996699755497 |
| 36 | 35933 | 34105.7652247912 | 1827.23477520878 |
| 37 | 6504 | 6038.00403193238 | 465.995968067619 |
| 38 | 638 | 460.571360426415 | 177.428639573584 |
| 39 | 2141 | 1526.11187952132 | 614.888120478681 |
| 40 | 163 | 159.118797705363 | 3.8812022946367 |
| 41 | 851 | 405.952200157381 | 445.047799842619 |
| 42 | 886 | 859.276253188754 | 26.7237468112455 |
| 43 | 3 | -15.1663399735585 | 18.1663399735585 |
| 44 | 238 | 39.9397700410283 | 198.060229958972 |
| 45 | 450 | 684.841448546757 | -234.841448546757 |
| 46 | 57 | 80.62515790203 | -23.62515790203 |
| 47 | 325 | 429.023296975716 | -104.023296975716 |
| 48 | 68 | 132.993693536023 | -64.9936935360228 |
| 49 | 343 | 469.265109047367 | -126.265109047367 |
| 50 | 2932 | 2820.59874086583 | 111.401259134167 |
| 51 | 132 | 379.841400346882 | -247.841400346882 |
| 52 | 2799 | 2422.23029469047 | 376.769705309533 |
| 53 | 814 | 613.369688234796 | 200.630311765204 |
| 54 | 24726 | 24453.6538031152 | 272.34619688477 |
| 55 | 9199 | 10232.0766219755 | -1033.07662197547 |
| 56 | 172 | 2169.32792461938 | -1997.32792461938 |
| 57 | 13856 | 10374.7017781577 | 3481.29822184229 |
| 58 | 1301 | 1558.53178275811 | -257.531782758107 |
| 59 | 21 | -20.2817642336144 | 41.2817642336144 |
| 60 | 177 | 40.3623738062138 | 136.637626193786 |
| 61 | 1308 | 1549.38080691794 | -241.380806917937 |
| 62 | 151 | 118.01854258321 | 32.9814574167903 |
| 63 | 1264 | 1320.93737023279 | -56.9373702327878 |
| 64 | 1165 | -100.651543609885 | 1265.65154360988 |
| 65 | 1019 | 793.710033570563 | 225.289966429437 |
| 66 | 94 | 352.358196889134 | -258.358196889134 |
| 67 | 413 | 2566.37099449568 | -2153.37099449568 |
| 68 | -64 | 65.6044271412459 | -129.604427141246 |
| 69 | 489 | 2464.00779349345 | -1975.00779349345 |
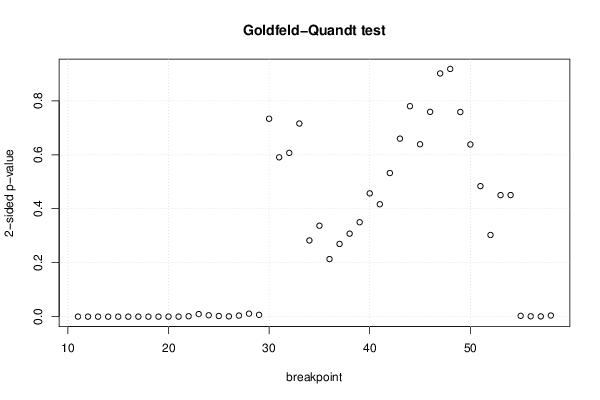
| Goldfeld-Quandt test for Heteroskedasticity | |||
| p-values | Alternative Hypothesis | ||
| breakpoint index | greater | 2-sided | less |
| 11 | 7.25796249277763e-05 | 0.000145159249855553 | 0.999927420375072 |
| 12 | 2.84136399496661e-06 | 5.68272798993322e-06 | 0.999997158636005 |
| 13 | 6.06916581316241e-07 | 1.21383316263248e-06 | 0.999999393083419 |
| 14 | 4.63045924298048e-07 | 9.26091848596097e-07 | 0.999999536954076 |
| 15 | 5.44237869928072e-08 | 1.08847573985614e-07 | 0.999999945576213 |
| 16 | 4.00036219668597e-09 | 8.00072439337195e-09 | 0.999999995999638 |
| 17 | 2.55952362199607e-10 | 5.11904724399215e-10 | 0.999999999744048 |
| 18 | 2.25184051080713e-11 | 4.50368102161426e-11 | 0.999999999977482 |
| 19 | 2.65062613305189e-09 | 5.30125226610378e-09 | 0.999999997349374 |
| 20 | 2.35831302399914e-09 | 4.71662604799829e-09 | 0.999999997641687 |
| 21 | 3.87001707751555e-07 | 7.74003415503111e-07 | 0.999999612998292 |
| 22 | 0.000743291801897732 | 0.00148658360379546 | 0.999256708198102 |
| 23 | 0.00473806892007257 | 0.00947613784014515 | 0.995261931079927 |
| 24 | 0.00256278478344375 | 0.00512556956688751 | 0.997437215216556 |
| 25 | 0.00121150711101514 | 0.00242301422203027 | 0.998788492888985 |
| 26 | 0.000601707984096538 | 0.00120341596819308 | 0.999398292015903 |
| 27 | 0.00198966604369708 | 0.00397933208739416 | 0.998010333956303 |
| 28 | 0.00546548526284815 | 0.0109309705256963 | 0.994534514737152 |
| 29 | 0.00334030020102199 | 0.00668060040204399 | 0.996659699798978 |
| 30 | 0.36671706709434 | 0.733434134188681 | 0.63328293290566 |
| 31 | 0.295300097981057 | 0.590600195962115 | 0.704699902018943 |
| 32 | 0.696533032912461 | 0.606933934175078 | 0.303466967087539 |
| 33 | 0.642154832863105 | 0.715690334273789 | 0.357845167136895 |
| 34 | 0.858750811483996 | 0.282498377032007 | 0.141249188516004 |
| 35 | 0.831518209352885 | 0.336963581294231 | 0.168481790647115 |
| 36 | 0.893320164625705 | 0.213359670748589 | 0.106679835374295 |
| 37 | 0.865285599904607 | 0.269428800190787 | 0.134714400095394 |
| 38 | 0.846204440004022 | 0.307591119991957 | 0.153795559995978 |
| 39 | 0.825015812481416 | 0.349968375037167 | 0.174984187518584 |
| 40 | 0.771503510288906 | 0.456992979422188 | 0.228496489711094 |
| 41 | 0.791685971747846 | 0.416628056504308 | 0.208314028252154 |
| 42 | 0.733848702871385 | 0.532302594257231 | 0.266151297128615 |
| 43 | 0.670129019414472 | 0.659741961171055 | 0.329870980585527 |
| 44 | 0.609968092472836 | 0.780063815054328 | 0.390031907527164 |
| 45 | 0.68053229916785 | 0.6389354016643 | 0.31946770083215 |
| 46 | 0.620535249168217 | 0.758929501663566 | 0.379464750831783 |
| 47 | 0.54930985497075 | 0.9013802900585 | 0.45069014502925 |
| 48 | 0.459016944473224 | 0.918033888946449 | 0.540983055526776 |
| 49 | 0.379230682389797 | 0.758461364779594 | 0.620769317610203 |
| 50 | 0.319095879889827 | 0.638191759779654 | 0.680904120110173 |
| 51 | 0.241862665651227 | 0.483725331302454 | 0.758137334348773 |
| 52 | 0.84865533938593 | 0.302689321228141 | 0.15134466061407 |
| 53 | 0.774839357241103 | 0.450321285517794 | 0.225160642758897 |
| 54 | 0.774689666607483 | 0.450620666785035 | 0.225310333392517 |
| 55 | 0.998494366580773 | 0.00301126683845495 | 0.00150563341922747 |
| 56 | 0.999303164977561 | 0.00139367004487889 | 0.000696835022439447 |
| 57 | 0.999548053777952 | 0.000903892444095545 | 0.000451946222047773 |
| 58 | 0.997895160314693 | 0.00420967937061484 | 0.00210483968530742 |
| Meta Analysis of Goldfeld-Quandt test for Heteroskedasticity | |||
| Description | # significant tests | % significant tests | OK/NOK |
| 1% type I error level | 22 | 0.458333333333333 | NOK |
| 5% type I error level | 23 | 0.479166666666667 | NOK |
| 10% type I error level | 23 | 0.479166666666667 | NOK |