| Multiple Linear Regression - Estimated Regression Equation |
| werkeloosheid[t] = -975.383322583056 -9.02296103619653bbp[t] + 5.00099684972349cpi[t] + 8.54402472806781prijsbouw[t] -2.76326468981967Q1[t] -6.72129040195627Q2[t] + 0.326178192550799Q3[t] -1.71225555914957t + e[t] |
| Multiple Linear Regression - Ordinary Least Squares | |||||
| Variable | Parameter | S.D. | T-STAT H0: parameter = 0 | 2-tail p-value | 1-tail p-value |
| (Intercept) | -975.383322583056 | 143.612393 | -6.7918 | 0 | 0 |
| bbp | -9.02296103619653 | 2.519683 | -3.581 | 0.000796 | 0.000398 |
| cpi | 5.00099684972349 | 1.053089 | 4.7489 | 1.9e-05 | 9e-06 |
| prijsbouw | 8.54402472806781 | 1.30178 | 6.5633 | 0 | 0 |
| Q1 | -2.76326468981967 | 13.037535 | -0.2119 | 0.833046 | 0.416523 |
| Q2 | -6.72129040195627 | 13.007237 | -0.5167 | 0.607714 | 0.303857 |
| Q3 | 0.326178192550799 | 13.011759 | 0.0251 | 0.980105 | 0.490052 |
| t | -1.71225555914957 | 0.46866 | -3.6535 | 0.000639 | 0.00032 |
| Multiple Linear Regression - Regression Statistics | |
| Multiple R | 0.90154782575271 |
| R-squared | 0.812788482119439 |
| Adjusted R-squared | 0.785486802428523 |
| F-TEST (value) | 29.7706401701687 |
| F-TEST (DF numerator) | 7 |
| F-TEST (DF denominator) | 48 |
| p-value | 2.1094237467878e-15 |
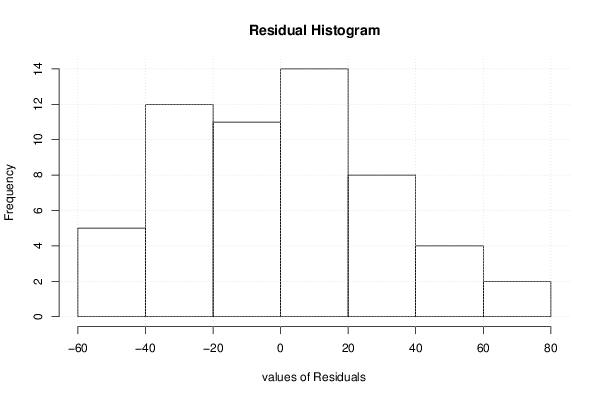
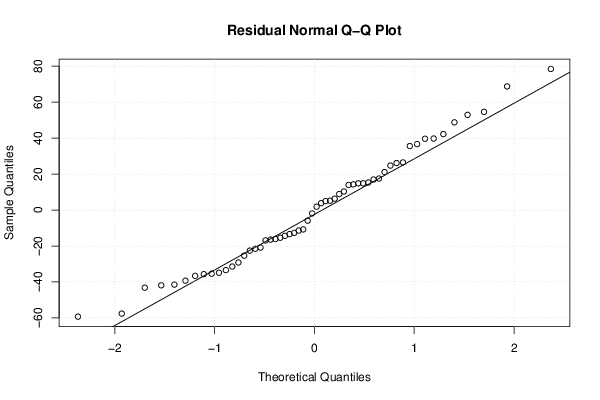
| Multiple Linear Regression - Residual Statistics | |
| Residual Standard Deviation | 34.3553487627989 |
| Sum Squared Residuals | 56653.9194534502 |
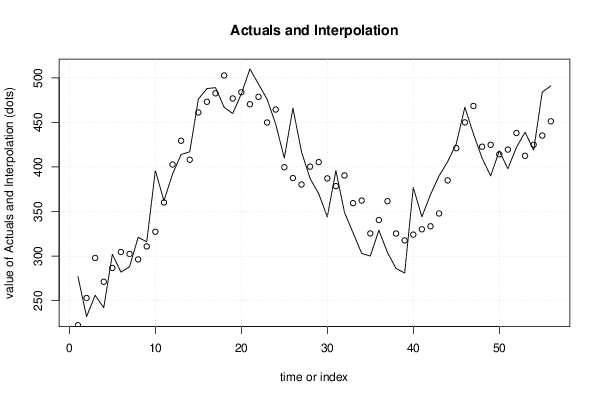
| Multiple Linear Regression - Actuals, Interpolation, and Residuals | |||
| Time or Index | Actuals | Interpolation Forecast | Residuals Prediction Error |
| 1 | 277 | 222.422517014965 | 54.5774829850347 |
| 2 | 232 | 252.865239935458 | -20.8652399354577 |
| 3 | 256 | 297.856485040939 | -41.8564850409387 |
| 4 | 242 | 271.165009768285 | -29.1650097682853 |
| 5 | 302 | 286.69347691821 | 15.3065230817899 |
| 6 | 282 | 304.570210924162 | -22.5702109241622 |
| 7 | 288 | 302.340431894702 | -14.3404318947023 |
| 8 | 321 | 296.280033956529 | 24.7199660434711 |
| 9 | 316 | 310.829468443203 | 5.1705315567968 |
| 10 | 396 | 327.248233477776 | 68.7517665222238 |
| 11 | 362 | 360.152425976845 | 1.84757402315502 |
| 12 | 392 | 402.771021144992 | -10.7710211449916 |
| 13 | 414 | 429.407508238078 | -15.407508238078 |
| 14 | 417 | 408.107146482035 | 8.89285351796466 |
| 15 | 476 | 461.163480007455 | 14.8365199925446 |
| 16 | 488 | 473.149004141675 | 14.8509958583249 |
| 17 | 489 | 482.697441778626 | 6.30255822137417 |
| 18 | 467 | 502.659234691543 | -35.6592346915431 |
| 19 | 460 | 476.882440384845 | -16.882440384845 |
| 20 | 482 | 483.866967669341 | -1.86696766934112 |
| 21 | 510 | 470.368486384175 | 39.6315136158247 |
| 22 | 493 | 478.722162998809 | 14.2778370011908 |
| 23 | 476 | 449.881277121895 | 26.1187228781046 |
| 24 | 448 | 464.451956518202 | -16.451956518202 |
| 25 | 410 | 399.689326864629 | 10.3106731353707 |
| 26 | 466 | 387.56007977224 | 78.4399202277595 |
| 27 | 417 | 380.329303893057 | 36.6706961069428 |
| 28 | 387 | 400.379916447216 | -13.3799164472159 |
| 29 | 370 | 405.406293542572 | -35.4062935425719 |
| 30 | 344 | 387.170023356745 | -43.1700233567449 |
| 31 | 396 | 378.481278506182 | 17.5187214938176 |
| 32 | 349 | 390.466802640402 | -41.466802640402 |
| 33 | 326 | 359.401335590972 | -33.4013355909719 |
| 34 | 303 | 362.275079047754 | -59.2750790477536 |
| 35 | 300 | 325.369104750901 | -25.3691047509007 |
| 36 | 329 | 340.418720455336 | -11.418720455336 |
| 37 | 304 | 361.57527439057 | -57.5752743905702 |
| 38 | 286 | 325.271922085357 | -39.2719220853571 |
| 39 | 281 | 317.562209898045 | -36.562209898045 |
| 40 | 377 | 324.067800874412 | 52.9321991255875 |
| 41 | 344 | 330.073210633019 | 13.9267893669811 |
| 42 | 369 | 333.425890397929 | 35.5741096020707 |
| 43 | 390 | 347.784064469483 | 42.2159355305167 |
| 44 | 406 | 384.901566432785 | 21.0984335672154 |
| 45 | 426 | 421.039950870196 | 4.96004912980374 |
| 46 | 467 | 450.02470481931 | 16.9752951806899 |
| 47 | 437 | 468.42600312433 | -31.4260031243302 |
| 48 | 410 | 422.709573116033 | -12.7095731160333 |
| 49 | 390 | 424.862332362617 | -34.8623323626171 |
| 50 | 418 | 414.191054241607 | 3.8089457583926 |
| 51 | 398 | 419.526267276965 | -21.5262672769649 |
| 52 | 422 | 438.118910859745 | -16.1189108597445 |
| 53 | 439 | 412.533376968167 | 26.4666230318334 |
| 54 | 419 | 424.909017769273 | -5.90901776927346 |
| 55 | 484 | 435.245227654354 | 48.7547723456455 |
| 56 | 491 | 451.252715975047 | 39.7472840249529 |
| Goldfeld-Quandt test for Heteroskedasticity | |||
| p-values | Alternative Hypothesis | ||
| breakpoint index | greater | 2-sided | less |
| 11 | 0.435645737278536 | 0.871291474557071 | 0.564354262721464 |
| 12 | 0.290876711332631 | 0.581753422665262 | 0.709123288667369 |
| 13 | 0.250006342583174 | 0.500012685166349 | 0.749993657416826 |
| 14 | 0.202124681990699 | 0.404249363981398 | 0.797875318009301 |
| 15 | 0.13866554049893 | 0.27733108099786 | 0.86133445950107 |
| 16 | 0.111557430563112 | 0.223114861126224 | 0.888442569436888 |
| 17 | 0.0704636571005177 | 0.140927314201035 | 0.929536342899482 |
| 18 | 0.196407761750381 | 0.392815523500762 | 0.803592238249619 |
| 19 | 0.163742463429713 | 0.327484926859427 | 0.836257536570287 |
| 20 | 0.107831362878776 | 0.215662725757553 | 0.892168637121224 |
| 21 | 0.080665979997729 | 0.161331959995458 | 0.919334020002271 |
| 22 | 0.0515905945346117 | 0.103181189069223 | 0.948409405465388 |
| 23 | 0.0390847506605035 | 0.0781695013210071 | 0.960915249339496 |
| 24 | 0.054037316450661 | 0.108074632901322 | 0.945962683549339 |
| 25 | 0.0732557825111135 | 0.146511565022227 | 0.926744217488886 |
| 26 | 0.209925327907573 | 0.419850655815147 | 0.790074672092427 |
| 27 | 0.297435336078564 | 0.594870672157128 | 0.702564663921436 |
| 28 | 0.379527924219932 | 0.759055848439865 | 0.620472075780068 |
| 29 | 0.511099908584437 | 0.977800182831125 | 0.488900091415563 |
| 30 | 0.581605972504807 | 0.836788054990386 | 0.418394027495193 |
| 31 | 0.84213250194428 | 0.31573499611144 | 0.15786749805572 |
| 32 | 0.821141713514126 | 0.357716572971747 | 0.178858286485874 |
| 33 | 0.877274796292556 | 0.245450407414887 | 0.122725203707444 |
| 34 | 0.881967138167385 | 0.23606572366523 | 0.118032861832615 |
| 35 | 0.828365096966349 | 0.343269806067302 | 0.171634903033651 |
| 36 | 0.767396911962656 | 0.465206176074689 | 0.232603088037344 |
| 37 | 0.709790223633101 | 0.580419552733797 | 0.290209776366899 |
| 38 | 0.701737495728511 | 0.596525008542978 | 0.298262504271489 |
| 39 | 0.838182054414459 | 0.323635891171081 | 0.16181794558554 |
| 40 | 0.912938808050907 | 0.174122383898186 | 0.0870611919490932 |
| 41 | 0.855294502332764 | 0.289410995334472 | 0.144705497667236 |
| 42 | 0.800456422117403 | 0.399087155765194 | 0.199543577882597 |
| 43 | 0.760076191813185 | 0.47984761637363 | 0.239923808186815 |
| 44 | 0.702439259621606 | 0.595121480756788 | 0.297560740378394 |
| 45 | 0.539905320768806 | 0.920189358462389 | 0.460094679231194 |
| Meta Analysis of Goldfeld-Quandt test for Heteroskedasticity | |||
| Description | # significant tests | % significant tests | OK/NOK |
| 1% type I error level | 0 | 0 | OK |
| 5% type I error level | 0 | 0 | OK |
| 10% type I error level | 1 | 0.0285714285714286 | OK |