| Multiple Linear Regression - Estimated Regression Equation |
| werkeloosheid[t] = -821.80901969682 -7.73236337144463bbp[t] + 2.19244864752551cpi[t] + 9.42168384625692prijsbouw[t] + e[t] |
| Multiple Linear Regression - Ordinary Least Squares | |||||
| Variable | Parameter | S.D. | T-STAT H0: parameter = 0 | 2-tail p-value | 1-tail p-value |
| (Intercept) | -821.80901969682 | 148.260263 | -5.543 | 1e-06 | 1e-06 |
| bbp | -7.73236337144463 | 2.71561 | -2.8474 | 0.006297 | 0.003149 |
| cpi | 2.19244864752551 | 0.776003 | 2.8253 | 0.006685 | 0.003342 |
| prijsbouw | 9.42168384625692 | 1.391725 | 6.7698 | 0 | 0 |
| Multiple Linear Regression - Regression Statistics | |
| Multiple R | 0.871472642347093 |
| R-squared | 0.759464566359425 |
| Adjusted R-squared | 0.74558752211093 |
| F-TEST (value) | 54.7281216921829 |
| F-TEST (DF numerator) | 3 |
| F-TEST (DF denominator) | 52 |
| p-value | 4.44089209850063e-16 |
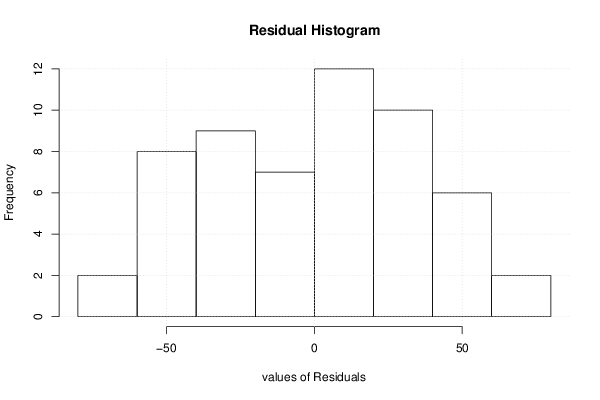
| Multiple Linear Regression - Residual Statistics | |
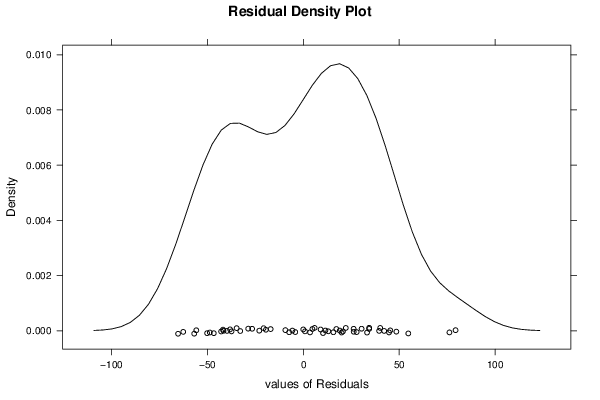
| Residual Standard Deviation | 37.4142080865911 |
| Sum Squared Residuals | 72790.7942708304 |
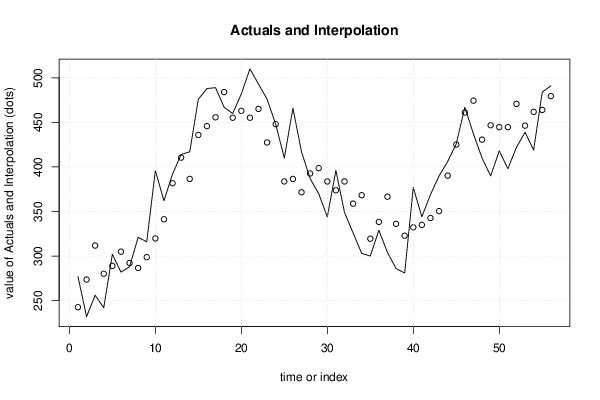
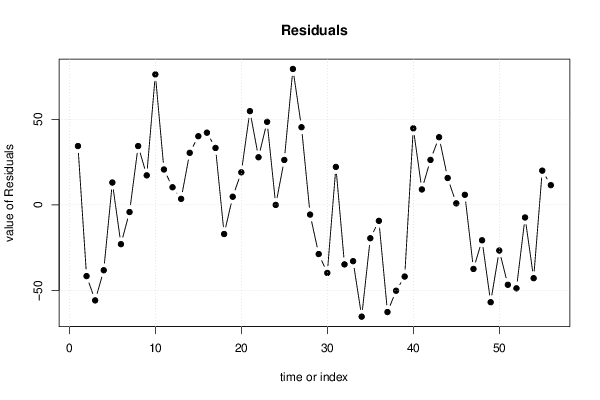
| Multiple Linear Regression - Actuals, Interpolation, and Residuals | |||
| Time or Index | Actuals | Interpolation Forecast | Residuals Prediction Error |
| 1 | 277 | 242.634969476226 | 34.3650305237736 |
| 2 | 232 | 273.595597835235 | -41.5955978352355 |
| 3 | 256 | 311.785461392976 | -55.7854613929764 |
| 4 | 242 | 280.172943777812 | -38.172943777812 |
| 5 | 302 | 288.942738367914 | 13.057261632086 |
| 6 | 282 | 304.941768156748 | -22.9417681567475 |
| 7 | 288 | 292.172618234097 | -4.17261823409696 |
| 8 | 321 | 286.632703510178 | 34.3672964898222 |
| 9 | 316 | 298.749964176673 | 17.2500358233265 |
| 10 | 396 | 319.785780516713 | 76.2142194832872 |
| 11 | 362 | 341.324725029465 | 20.6752749705346 |
| 12 | 392 | 381.707037234732 | 10.2929627652682 |
| 13 | 414 | 410.475216946216 | 3.52478305378426 |
| 14 | 417 | 386.595062702496 | 30.404937297504 |
| 15 | 476 | 435.895930581306 | 40.1040694186939 |
| 16 | 488 | 445.820742600276 | 42.1792573997238 |
| 17 | 489 | 455.745554619246 | 33.2544453807536 |
| 18 | 467 | 484.010606158017 | -17.0106061580171 |
| 19 | 460 | 455.242426446533 | 4.75757355346684 |
| 20 | 482 | 462.974789817978 | 19.0252101820222 |
| 21 | 510 | 455.242426446533 | 54.7575735534669 |
| 22 | 493 | 465.167238465503 | 27.8327615344967 |
| 23 | 476 | 427.480503080476 | 48.5194969195244 |
| 24 | 448 | 448.013191247802 | -0.0131912478017405 |
| 25 | 410 | 383.750724798816 | 26.2492752011844 |
| 26 | 466 | 386.595062702496 | 79.404937297504 |
| 27 | 417 | 371.63346413232 | 45.36653586768 |
| 28 | 387 | 392.669280472359 | -5.66928047235932 |
| 29 | 370 | 398.712323368992 | -28.7123233689917 |
| 30 | 344 | 383.750724798816 | -39.7507247988156 |
| 31 | 396 | 373.825912779846 | 22.1740872201545 |
| 32 | 349 | 383.750724798816 | -34.7507247988156 |
| 33 | 326 | 358.864314209669 | -32.8643142096695 |
| 34 | 303 | 368.285998055926 | -65.2859980559264 |
| 35 | 300 | 319.488258349829 | -19.4882583498295 |
| 36 | 329 | 338.331626042343 | -9.33162604234332 |
| 37 | 304 | 366.596677581114 | -62.5966775811141 |
| 38 | 286 | 336.139177394818 | -50.1391773948178 |
| 39 | 281 | 322.866899299454 | -41.8668992994541 |
| 40 | 377 | 332.288583145711 | 44.711416854289 |
| 41 | 344 | 334.98415996595 | 9.01584003405028 |
| 42 | 369 | 342.716523337394 | 26.2834766626057 |
| 43 | 390 | 350.448886708839 | 39.551113291161 |
| 44 | 406 | 390.296895868161 | 15.7031041318388 |
| 45 | 426 | 425.108118476277 | 0.891881523722553 |
| 46 | 467 | 461.105533386493 | 5.89446661350717 |
| 47 | 437 | 474.408986355088 | -37.4089863550876 |
| 48 | 410 | 430.679208073428 | -20.6792080734276 |
| 49 | 390 | 446.858173818934 | -56.8581738189336 |
| 50 | 418 | 444.665725171408 | -26.6657251714081 |
| 51 | 398 | 444.665725171408 | -46.6657251714081 |
| 52 | 422 | 470.738328062653 | -48.7383280626534 |
| 53 | 439 | 446.35504564622 | -7.35504564622043 |
| 54 | 419 | 461.81977238911 | -42.8197723891097 |
| 55 | 484 | 464.012221036635 | 19.9877789633648 |
| 56 | 491 | 479.476947779524 | 11.5230522204756 |
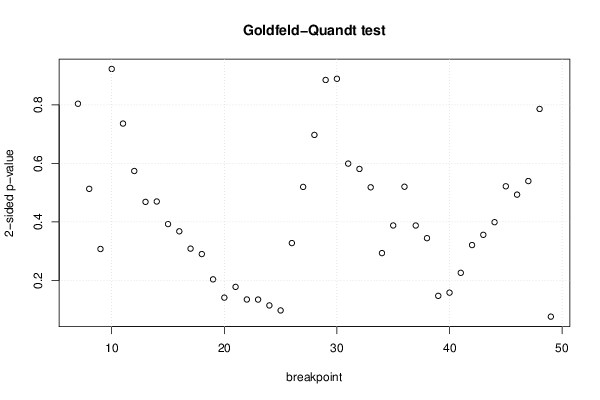
| Goldfeld-Quandt test for Heteroskedasticity | |||
| p-values | Alternative Hypothesis | ||
| breakpoint index | greater | 2-sided | less |
| 7 | 0.401875523019751 | 0.803751046039501 | 0.598124476980249 |
| 8 | 0.256503661391934 | 0.513007322783867 | 0.743496338608066 |
| 9 | 0.153732696815149 | 0.307465393630298 | 0.846267303184851 |
| 10 | 0.461346117601319 | 0.922692235202639 | 0.538653882398681 |
| 11 | 0.368032756512252 | 0.736065513024503 | 0.631967243487748 |
| 12 | 0.287008353893915 | 0.574016707787829 | 0.712991646106085 |
| 13 | 0.234252762755208 | 0.468505525510416 | 0.765747237244792 |
| 14 | 0.234899080220315 | 0.469798160440629 | 0.765100919779685 |
| 15 | 0.196365150855583 | 0.392730301711165 | 0.803634849144417 |
| 16 | 0.183957160125899 | 0.367914320251797 | 0.816042839874101 |
| 17 | 0.1543152946039 | 0.3086305892078 | 0.8456847053961 |
| 18 | 0.145094286446998 | 0.290188572893996 | 0.854905713553002 |
| 19 | 0.10188909697936 | 0.20377819395872 | 0.89811090302064 |
| 20 | 0.0706636004318678 | 0.141327200863736 | 0.929336399568132 |
| 21 | 0.0890248547974567 | 0.178049709594913 | 0.910975145202543 |
| 22 | 0.0674592838543509 | 0.134918567708702 | 0.932540716145649 |
| 23 | 0.0672990587256595 | 0.134598117451319 | 0.93270094127434 |
| 24 | 0.0573040253083068 | 0.114608050616614 | 0.942695974691693 |
| 25 | 0.0487738772901811 | 0.0975477545803622 | 0.951226122709819 |
| 26 | 0.163854990128815 | 0.327709980257631 | 0.836145009871184 |
| 27 | 0.259785980903672 | 0.519571961807344 | 0.740214019096328 |
| 28 | 0.348655145952298 | 0.697310291904597 | 0.651344854047702 |
| 29 | 0.442526917621683 | 0.885053835243366 | 0.557473082378317 |
| 30 | 0.555492511341749 | 0.889014977316503 | 0.444507488658251 |
| 31 | 0.700376344911756 | 0.599247310176488 | 0.299623655088244 |
| 32 | 0.709510606915531 | 0.580978786168938 | 0.290489393084469 |
| 33 | 0.740863347970911 | 0.518273304058178 | 0.259136652029089 |
| 34 | 0.853270699327764 | 0.293458601344473 | 0.146729300672236 |
| 35 | 0.806062129700509 | 0.387875740598982 | 0.193937870299491 |
| 36 | 0.739898185977334 | 0.520203628045332 | 0.260101814022666 |
| 37 | 0.806133054127157 | 0.387733891745686 | 0.193866945872843 |
| 38 | 0.827770160388033 | 0.344459679223934 | 0.172229839611967 |
| 39 | 0.926284755596602 | 0.147430488806796 | 0.073715244403398 |
| 40 | 0.92090548083223 | 0.15818903833554 | 0.0790945191677699 |
| 41 | 0.886973947387496 | 0.226052105225008 | 0.113026052612504 |
| 42 | 0.839532107302101 | 0.320935785395798 | 0.160467892697899 |
| 43 | 0.822068358679677 | 0.355863282640646 | 0.177931641320323 |
| 44 | 0.800481625318024 | 0.399036749363952 | 0.199518374681976 |
| 45 | 0.739100684276896 | 0.521798631446208 | 0.260899315723104 |
| 46 | 0.753385450531436 | 0.493229098937129 | 0.246614549468564 |
| 47 | 0.730192382367272 | 0.539615235265457 | 0.269807617632728 |
| 48 | 0.606999871011459 | 0.786000257977083 | 0.393000128988541 |
| 49 | 0.961864673721586 | 0.0762706525568275 | 0.0381353262784137 |
| Meta Analysis of Goldfeld-Quandt test for Heteroskedasticity | |||
| Description | # significant tests | % significant tests | OK/NOK |
| 1% type I error level | 0 | 0 | OK |
| 5% type I error level | 0 | 0 | OK |
| 10% type I error level | 2 | 0.0465116279069767 | OK |