Free Statistics
of Irreproducible Research!
Description of Statistical Computation | |||||||||||||||||||||||||||||||||
|---|---|---|---|---|---|---|---|---|---|---|---|---|---|---|---|---|---|---|---|---|---|---|---|---|---|---|---|---|---|---|---|---|---|
| Author's title | |||||||||||||||||||||||||||||||||
| Author | *The author of this computation has been verified* | ||||||||||||||||||||||||||||||||
| R Software Module | rwasp_meanversusmedian.wasp | ||||||||||||||||||||||||||||||||
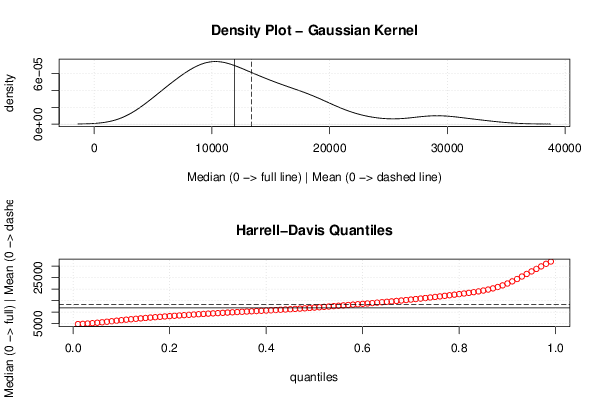
| Title produced by software | Mean versus Median | ||||||||||||||||||||||||||||||||
| Date of computation | Sun, 09 Dec 2012 13:03:23 -0500 | ||||||||||||||||||||||||||||||||
| Cite this page as follows | Statistical Computations at FreeStatistics.org, Office for Research Development and Education, URL https://freestatistics.org/blog/index.php?v=date/2012/Dec/09/t1355076215lgn86wyrtak02m1.htm/, Retrieved Fri, 26 Apr 2024 20:06:52 +0000 | ||||||||||||||||||||||||||||||||
| Statistical Computations at FreeStatistics.org, Office for Research Development and Education, URL https://freestatistics.org/blog/index.php?pk=198019, Retrieved Fri, 26 Apr 2024 20:06:52 +0000 | |||||||||||||||||||||||||||||||||
| QR Codes: | |||||||||||||||||||||||||||||||||
|
| |||||||||||||||||||||||||||||||||
| Original text written by user: | |||||||||||||||||||||||||||||||||
| IsPrivate? | No (this computation is public) | ||||||||||||||||||||||||||||||||
| User-defined keywords | |||||||||||||||||||||||||||||||||
| Estimated Impact | 101 | ||||||||||||||||||||||||||||||||
Tree of Dependent Computations | |||||||||||||||||||||||||||||||||
| Family? (F = Feedback message, R = changed R code, M = changed R Module, P = changed Parameters, D = changed Data) | |||||||||||||||||||||||||||||||||
| - [Central Tendency] [Arabica Price in ...] [2008-01-19 12:03:37] [74be16979710d4c4e7c6647856088456] - RM D [Percentiles] [] [2010-11-16 19:22:04] [b98453cac15ba1066b407e146608df68] - R D [Percentiles] [normal QQ plot] [2012-11-21 17:16:43] [93b3e8d0ee7e4ccb504c2c04707a9358] - RM [Mean versus Median] [gem mediaan] [2012-12-09 18:03:23] [18a55f974a2e8651a7d8da0218fcbdb6] [Current] | |||||||||||||||||||||||||||||||||
| Feedback Forum | |||||||||||||||||||||||||||||||||
Post a new message | |||||||||||||||||||||||||||||||||
Dataset | |||||||||||||||||||||||||||||||||
| Dataseries X: | |||||||||||||||||||||||||||||||||
12584 9441 18960 21480 10766 13059 8589 4965 4803 7240 10906 8561 6389 14372 18149 6309 13051 12754 10860 9574 19110 29585 21122 14522 17330 18119 10902 29158 16065 10376 10999 17950 15418 12618 16561 8022 9567 9045 8172 13708 11259 10518 9301 5197 11259 10518 9301 5197 6758 7304 7628 14265 13054 15336 14682 27804 16022 24009 32613 19111 | |||||||||||||||||||||||||||||||||
Tables (Output of Computation) | |||||||||||||||||||||||||||||||||
| |||||||||||||||||||||||||||||||||
Figures (Output of Computation) | |||||||||||||||||||||||||||||||||
Input Parameters & R Code | |||||||||||||||||||||||||||||||||
| Parameters (Session): | |||||||||||||||||||||||||||||||||
| Parameters (R input): | |||||||||||||||||||||||||||||||||
| R code (references can be found in the software module): | |||||||||||||||||||||||||||||||||
library(Hmisc) | |||||||||||||||||||||||||||||||||