| Tabulation of Results | ||||
| Learning x Software | ||||
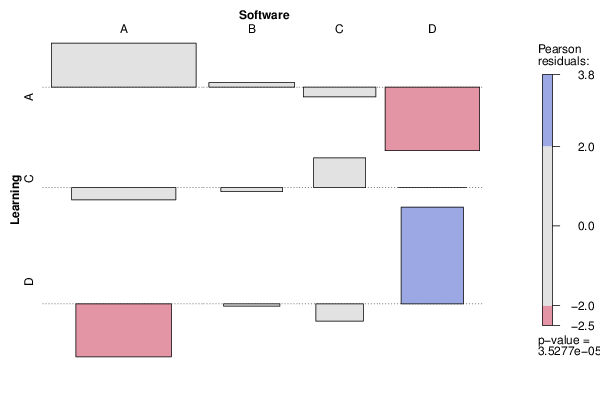
| A | B | C | D | A | 52 | 15 | 9 | 7 | C | 19 | 7 | 8 | 9 | D | 9 | 6 | 3 | 18 |
| Tabulation of Expected Results | ||||
| Learning x Software | ||||
| A | B | C | D | A | 40.99 | 14.35 | 10.25 | 17.42 | C | 21.23 | 7.43 | 5.31 | 9.02 | D | 17.78 | 6.22 | 4.44 | 7.56 |
| Statistical Results | |
| Pearson's Chi-squared test with simulated p-value (based on 2000 replicates) | |
| Exact Pearson Chi Square Statistic | 30.25 |
| P value | 0 |