| Tabulation of Results | ||
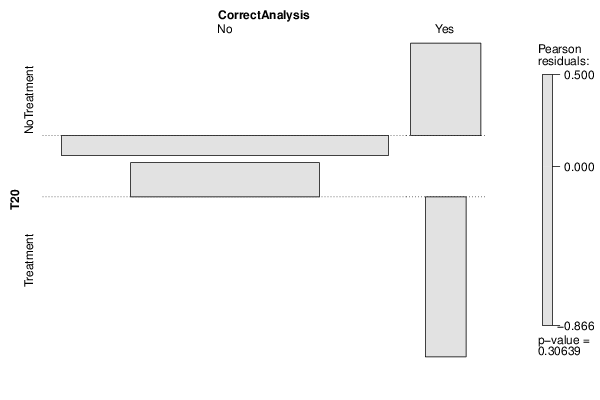
| T20 x CorrectAnalysis | ||
| No | Yes | NoTreatment | 48 | 3 | Treatment | 17 | 0 |
| Tabulation of Expected Results | ||
| T20 x CorrectAnalysis | ||
| No | Yes | NoTreatment | 48.75 | 2.25 | Treatment | 16.25 | 0.75 |
| Statistical Results | |
| Pearson's Chi-squared test with Yates' continuity correction | |
| Pearson Chi Square Statistic | 0.12 |
| Degrees of Freedom | 1 |
| P value | 0.73 |