Free Statistics
of Irreproducible Research!
Description of Statistical Computation | |||||||||||||||||||||||||||||||||||||||||||||||||||||||||||||||||||||||||||||||||||||||||||||||||
|---|---|---|---|---|---|---|---|---|---|---|---|---|---|---|---|---|---|---|---|---|---|---|---|---|---|---|---|---|---|---|---|---|---|---|---|---|---|---|---|---|---|---|---|---|---|---|---|---|---|---|---|---|---|---|---|---|---|---|---|---|---|---|---|---|---|---|---|---|---|---|---|---|---|---|---|---|---|---|---|---|---|---|---|---|---|---|---|---|---|---|---|---|---|---|---|---|---|
| Author's title | |||||||||||||||||||||||||||||||||||||||||||||||||||||||||||||||||||||||||||||||||||||||||||||||||
| Author | *The author of this computation has been verified* | ||||||||||||||||||||||||||||||||||||||||||||||||||||||||||||||||||||||||||||||||||||||||||||||||
| R Software Module | rwasp_chi_squared_tests.wasp | ||||||||||||||||||||||||||||||||||||||||||||||||||||||||||||||||||||||||||||||||||||||||||||||||
| Title produced by software | Chi-Squared Test, McNemar Test, and Fisher Exact Test | ||||||||||||||||||||||||||||||||||||||||||||||||||||||||||||||||||||||||||||||||||||||||||||||||
| Date of computation | Sun, 09 Dec 2012 11:20:41 -0500 | ||||||||||||||||||||||||||||||||||||||||||||||||||||||||||||||||||||||||||||||||||||||||||||||||
| Cite this page as follows | Statistical Computations at FreeStatistics.org, Office for Research Development and Education, URL https://freestatistics.org/blog/index.php?v=date/2012/Dec/09/t1355070056cjmeada8j2vy8vb.htm/, Retrieved Sat, 20 Apr 2024 11:04:58 +0000 | ||||||||||||||||||||||||||||||||||||||||||||||||||||||||||||||||||||||||||||||||||||||||||||||||
| Statistical Computations at FreeStatistics.org, Office for Research Development and Education, URL https://freestatistics.org/blog/index.php?pk=197965, Retrieved Sat, 20 Apr 2024 11:04:58 +0000 | |||||||||||||||||||||||||||||||||||||||||||||||||||||||||||||||||||||||||||||||||||||||||||||||||
| QR Codes: | |||||||||||||||||||||||||||||||||||||||||||||||||||||||||||||||||||||||||||||||||||||||||||||||||
|
| |||||||||||||||||||||||||||||||||||||||||||||||||||||||||||||||||||||||||||||||||||||||||||||||||
| Original text written by user: | |||||||||||||||||||||||||||||||||||||||||||||||||||||||||||||||||||||||||||||||||||||||||||||||||
| IsPrivate? | No (this computation is public) | ||||||||||||||||||||||||||||||||||||||||||||||||||||||||||||||||||||||||||||||||||||||||||||||||
| User-defined keywords | |||||||||||||||||||||||||||||||||||||||||||||||||||||||||||||||||||||||||||||||||||||||||||||||||
| Estimated Impact | 126 | ||||||||||||||||||||||||||||||||||||||||||||||||||||||||||||||||||||||||||||||||||||||||||||||||
Tree of Dependent Computations | |||||||||||||||||||||||||||||||||||||||||||||||||||||||||||||||||||||||||||||||||||||||||||||||||
| Family? (F = Feedback message, R = changed R code, M = changed R Module, P = changed Parameters, D = changed Data) | |||||||||||||||||||||||||||||||||||||||||||||||||||||||||||||||||||||||||||||||||||||||||||||||||
| - [Chi-Squared Test, McNemar Test, and Fisher Exact Test] [] [2012-10-21 14:51:03] [235928acca9c96310100390b3cde8f3b] - D [Chi-Squared Test, McNemar Test, and Fisher Exact Test] [] [2012-12-09 16:20:41] [c52127b355a401c4b5ab4a80e41e35a5] [Current] - RMPD [One-Way-Between-Groups ANOVA- Free Statistics Software (Calculator)] [] [2012-12-12 12:20:35] [235928acca9c96310100390b3cde8f3b] - RMPD [One-Way-Between-Groups ANOVA- Free Statistics Software (Calculator)] [] [2012-12-12 12:23:23] [235928acca9c96310100390b3cde8f3b] - RMPD [Multiple Regression] [] [2012-12-12 13:15:40] [235928acca9c96310100390b3cde8f3b] - R D [Multiple Regression] [Paper- anova(test...] [2012-12-13 18:15:58] [b43eb6e2e60f3928e6b8367ff6c5b484] - P [Multiple Regression] [Paper- Multiple r...] [2012-12-14 08:29:44] [74be16979710d4c4e7c6647856088456] - P [Multiple Regression] [Multiple regressi...] [2012-12-14 08:35:54] [74be16979710d4c4e7c6647856088456] - [Multiple Regression] [Paper deel 5 Mult...] [2012-12-20 16:36:40] [8c30f4dd45e15fd207e4faf2fdf6253e] - MP [Multiple Regression] [PAPER Multiple Re...] [2012-12-20 17:37:39] [4beecb4e29f2a257543dd9eec92fc58e] - [Multiple Regression] [Paper deel 5 Mult...] [2012-12-20 16:10:52] [8c30f4dd45e15fd207e4faf2fdf6253e] - [Multiple Regression] [Paper deel 5 Mult...] [2012-12-20 16:10:52] [8c30f4dd45e15fd207e4faf2fdf6253e] - R D [Multiple Regression] [Paper seizoenalit...] [2012-12-14 14:32:56] [d63e92c9ef4b8a0e48798c0b0ce2077f] - RMPD [Notched Boxplots] [] [2012-12-16 14:29:59] [5957e05d0a2909114b19c7dddf0f27be] - RMPD [Histogram] [] [2012-12-16 14:50:09] [5957e05d0a2909114b19c7dddf0f27be] - R PD [Multiple Regression] [] [2012-12-16 16:42:37] [235928acca9c96310100390b3cde8f3b] - R PD [Multiple Regression] [] [2012-12-16 17:13:55] [456f9f31a5baae2eb9a0b13ee35c0d42] - [Multiple Regression] [meervoudige regre...] [2012-12-16 17:20:43] [456f9f31a5baae2eb9a0b13ee35c0d42] - MP [Multiple Regression] [] [2012-12-19 18:29:18] [a119987d898559f8af06c0628f264b38] - MP [Multiple Regression] [] [2012-12-20 19:43:49] [a119987d898559f8af06c0628f264b38] - PD [Multiple Regression] [] [2012-12-16 18:09:28] [235928acca9c96310100390b3cde8f3b] - PD [Multiple Regression] [] [2012-12-16 18:13:43] [235928acca9c96310100390b3cde8f3b] - R PD [Multiple Regression] [Multiple regressie] [2012-12-16 17:40:19] [37f59b7a972c225c3d32d27fed432050] - R P [Multiple Regression] [Non-Rote Learning...] [2012-12-16 17:50:47] [37f59b7a972c225c3d32d27fed432050] - RMPD [One-Way-Between-Groups ANOVA- Free Statistics Software (Calculator)] [Paper Deel 5] [2012-12-21 11:18:22] [f069503e2a3869e5c2794f1841bac1ef] - RMPD [One-Way-Between-Groups ANOVA- Free Statistics Software (Calculator)] [Paper Deel 5] [2012-12-21 11:18:22] [f069503e2a3869e5c2794f1841bac1ef] - RMPD [Chi-Squared Test, McNemar Test, and Fisher Exact Test] [Paper Deel 5] [2012-12-21 11:22:01] [f069503e2a3869e5c2794f1841bac1ef] - RMPD [One-Way-Between-Groups ANOVA- Free Statistics Software (Calculator)] [Paper deel 5] [2012-12-21 11:39:15] [f069503e2a3869e5c2794f1841bac1ef] - R PD [Multiple Regression] [] [2012-12-22 09:55:26] [8fcd082199f7dbedf65d69a953eb5ad7] - R PD [One-Way-Between-Groups ANOVA- Free Statistics Software (Calculator)] [] [2012-12-16 16:13:10] [235928acca9c96310100390b3cde8f3b] | |||||||||||||||||||||||||||||||||||||||||||||||||||||||||||||||||||||||||||||||||||||||||||||||||
| Feedback Forum | |||||||||||||||||||||||||||||||||||||||||||||||||||||||||||||||||||||||||||||||||||||||||||||||||
Post a new message | |||||||||||||||||||||||||||||||||||||||||||||||||||||||||||||||||||||||||||||||||||||||||||||||||
Dataset | |||||||||||||||||||||||||||||||||||||||||||||||||||||||||||||||||||||||||||||||||||||||||||||||||
| Dataseries X: | |||||||||||||||||||||||||||||||||||||||||||||||||||||||||||||||||||||||||||||||||||||||||||||||||
'Treatment' 'No' 'NoTreatment' 'No' 'NoTreatment' 'No' 'NoTreatment' 'No' 'NoTreatment' 'No' 'NoTreatment' 'No' 'NoTreatment' 'No' 'Treatment' 'No' 'NoTreatment' 'No' 'NoTreatment' 'No' 'Treatment' 'No' 'NoTreatment' 'No' 'NoTreatment' 'No' 'Treatment' 'No' 'NoTreatment' 'No' 'Treatment' 'No' 'Treatment' 'Yes' 'Treatment' 'No' 'NoTreatment' 'No' 'Treatment' 'Yes' 'NoTreatment' 'No' 'NoTreatment' 'No' 'NoTreatment' 'No' 'NoTreatment' 'No' 'Treatment' 'No' 'NoTreatment' 'No' 'NoTreatment' 'No' 'NoTreatment' 'No' 'NoTreatment' 'No' 'NoTreatment' 'No' 'NoTreatment' 'No' 'NoTreatment' 'No' 'NoTreatment' 'No' 'Treatment' 'No' 'NoTreatment' 'No' 'NoTreatment' 'No' 'Treatment' 'No' 'NoTreatment' 'No' 'NoTreatment' 'No' 'Treatment' 'No' 'NoTreatment' 'Yes' 'NoTreatment' 'No' 'NoTreatment' 'No' 'Treatment' 'No' 'NoTreatment' 'No' 'NoTreatment' 'No' 'NoTreatment' 'No' 'NoTreatment' 'No' 'NoTreatment' 'No' 'NoTreatment' 'No' 'Treatment' 'No' 'Treatment' 'Yes' 'NoTreatment' 'No' 'NoTreatment' 'Yes' 'NoTreatment' 'No' 'Treatment' 'No' 'NoTreatment' 'No' 'NoTreatment' 'No' 'NoTreatment' 'No' 'Treatment' 'Yes' 'Treatment' 'No' 'NoTreatment' 'No' 'NoTreatment' 'No' 'Treatment' 'No' 'NoTreatment' 'No' 'NoTreatment' 'No' 'Treatment' 'Yes' 'NoTreatment' 'No' 'NoTreatment' 'No' 'NoTreatment' 'No' 'NoTreatment' 'No' 'NoTreatment' 'No' 'NoTreatment' 'No' 'NoTreatment' 'No' 'NoTreatment' 'No' 'Treatment' 'No' 'NoTreatment' 'No' 'NoTreatment' 'No' 'Treatment' 'Yes' 'Treatment' 'No' 'NoTreatment' 'No' 'NoTreatment' 'No' 'NoTreatment' 'No' 'NoTreatment' 'Yes' 'NoTreatment' 'No' 'NoTreatment' 'No' NA 'No' NA 'No' NA 'No' NA 'No' NA 'No' NA 'No' NA 'No' NA 'No' NA 'No' NA 'No' NA 'No' NA 'No' NA 'No' NA 'No' NA 'No' NA 'No' NA 'No' NA 'No' NA 'No' NA 'No' NA 'No' NA 'No' NA 'No' NA 'No' NA 'No' NA 'No' NA 'No' NA 'No' NA 'No' NA 'No' NA 'No' NA 'No' NA 'No' NA 'No' NA 'No' NA 'No' NA 'No' NA 'No' NA 'No' NA 'No' NA 'No' NA 'No' NA 'No' NA 'No' NA 'No' NA 'No' NA 'No' NA 'No' NA 'No' NA 'No' NA 'No' NA 'No' NA 'No' NA 'No' NA 'Yes' NA 'No' NA 'No' NA 'No' NA 'No' NA 'No' NA 'No' NA 'No' NA 'No' NA 'No' NA 'No' NA 'Yes' NA 'Yes' NA 'No' | |||||||||||||||||||||||||||||||||||||||||||||||||||||||||||||||||||||||||||||||||||||||||||||||||
Tables (Output of Computation) | |||||||||||||||||||||||||||||||||||||||||||||||||||||||||||||||||||||||||||||||||||||||||||||||||
| |||||||||||||||||||||||||||||||||||||||||||||||||||||||||||||||||||||||||||||||||||||||||||||||||
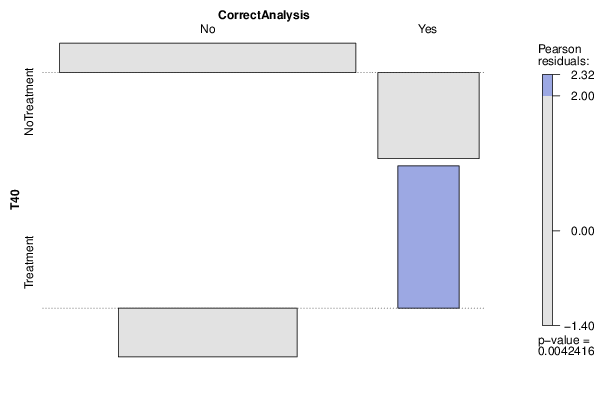
Figures (Output of Computation) | |||||||||||||||||||||||||||||||||||||||||||||||||||||||||||||||||||||||||||||||||||||||||||||||||
Input Parameters & R Code | |||||||||||||||||||||||||||||||||||||||||||||||||||||||||||||||||||||||||||||||||||||||||||||||||
| Parameters (Session): | |||||||||||||||||||||||||||||||||||||||||||||||||||||||||||||||||||||||||||||||||||||||||||||||||
| par1 = 1 ; par2 = 2 ; par3 = Exact Pearson Chi-Squared by Simulation ; | |||||||||||||||||||||||||||||||||||||||||||||||||||||||||||||||||||||||||||||||||||||||||||||||||
| Parameters (R input): | |||||||||||||||||||||||||||||||||||||||||||||||||||||||||||||||||||||||||||||||||||||||||||||||||
| par1 = 1 ; par2 = 2 ; par3 = Exact Pearson Chi-Squared by Simulation ; | |||||||||||||||||||||||||||||||||||||||||||||||||||||||||||||||||||||||||||||||||||||||||||||||||
| R code (references can be found in the software module): | |||||||||||||||||||||||||||||||||||||||||||||||||||||||||||||||||||||||||||||||||||||||||||||||||
library(vcd) | |||||||||||||||||||||||||||||||||||||||||||||||||||||||||||||||||||||||||||||||||||||||||||||||||