| Tabulation of Results | ||
| A x B | ||
| 0 | 1 | 0 | 4 | 8 | 1 | 5 | 20 |
| Tabulation of Expected Results | ||
| A x B | ||
| 0 | 1 | 0 | 2.92 | 9.08 | 1 | 6.08 | 18.92 |
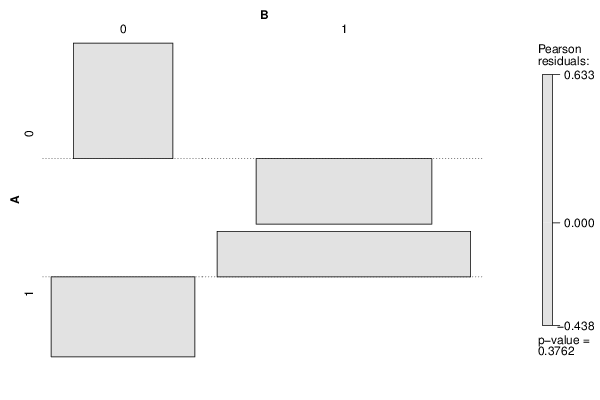
| Statistical Results | |
| Pearson's Chi-squared test with Yates' continuity correction | |
| Pearson Chi Square Statistic | 0.23 |
| Degrees of Freedom | 1 |
| P value | 0.63 |