| Multiple Linear Regression - Estimated Regression Equation |
| Assaults[t] = + 75.2168000541277 -2.91687090279448e-05BachDegrees[t] + 0.709083500395866PoliceExp[t] + 3.98758316931819Population[t] -0.0505939559173183Density[t] + 7.03073495152404Unemployment[t] + e[t] |
| Multiple Linear Regression - Ordinary Least Squares | |||||
| Variable | Parameter | S.D. | T-STAT H0: parameter = 0 | 2-tail p-value | 1-tail p-value |
| (Intercept) | 75.2168000541277 | 81.481175 | 0.9231 | 0.359906 | 0.179953 |
| BachDegrees | -2.91687090279448e-05 | 3.4e-05 | -0.8649 | 0.390763 | 0.195381 |
| PoliceExp | 0.709083500395866 | 0.234068 | 3.0294 | 0.003703 | 0.001852 |
| Population | 3.98758316931819 | 2.787848 | 1.4303 | 0.158174 | 0.079087 |
| Density | -0.0505939559173183 | 0.074106 | -0.6827 | 0.497596 | 0.248798 |
| Unemployment | 7.03073495152404 | 9.039051 | 0.7778 | 0.43995 | 0.219975 |
| Multiple Linear Regression - Regression Statistics | |
| Multiple R | 0.470197739682809 |
| R-squared | 0.221085914402823 |
| Adjusted R-squared | 0.151540013903075 |
| F-TEST (value) | 3.17899276325604 |
| F-TEST (DF numerator) | 5 |
| F-TEST (DF denominator) | 56 |
| p-value | 0.0135047150890609 |
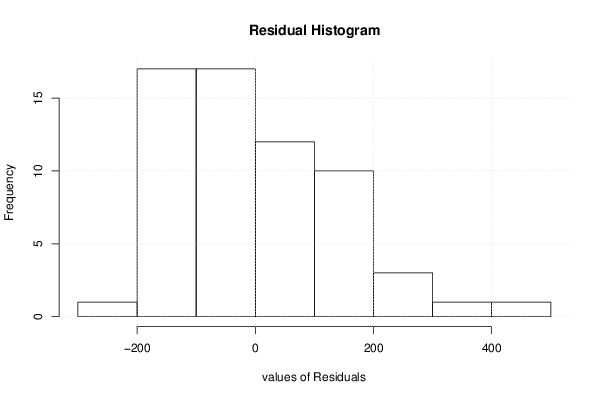
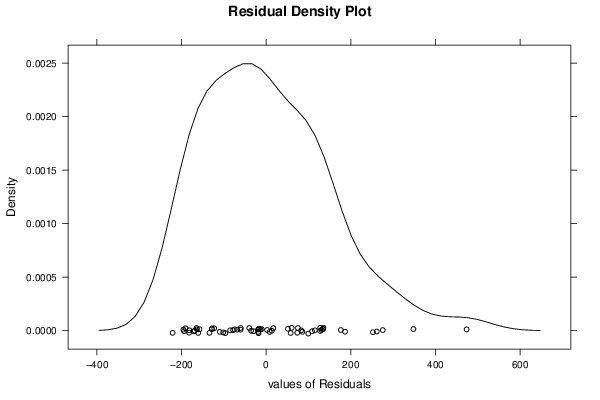
| Multiple Linear Regression - Residual Statistics | |
| Residual Standard Deviation | 153.357046903804 |
| Sum Squared Residuals | 1317029.49476311 |
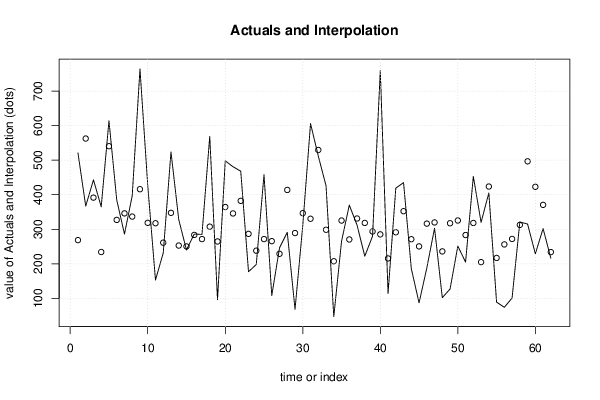
| Multiple Linear Regression - Actuals, Interpolation, and Residuals | |||
| Time or Index | Actuals | Interpolation Forecast | Residuals Prediction Error |
| 1 | 521 | 268.571063249648 | 252.428936750352 |
| 2 | 367 | 562.537238488845 | -195.537238488845 |
| 3 | 443 | 391.524338729782 | 51.4756612702182 |
| 4 | 365 | 234.098597923585 | 130.901402076415 |
| 5 | 614 | 540.357544133493 | 73.6424558665068 |
| 6 | 385 | 327.042966923493 | 57.957033076507 |
| 7 | 286 | 346.02312333647 | -60.0231233364698 |
| 8 | 397 | 336.683146911781 | 60.3168530882193 |
| 9 | 764 | 415.890313210908 | 348.109686789092 |
| 10 | 427 | 318.505682097822 | 108.494317902178 |
| 11 | 153 | 317.392117721737 | -164.392117721737 |
| 12 | 231 | 261.10050975421 | -30.1005097542104 |
| 13 | 524 | 347.457922031541 | 176.542077968459 |
| 14 | 328 | 252.812350013506 | 75.1876499864942 |
| 15 | 240 | 250.34729337982 | -10.3472933798198 |
| 16 | 286 | 283.591010542542 | 2.40898945745807 |
| 17 | 285 | 271.590822978211 | 13.409177021789 |
| 18 | 569 | 307.47347597595 | 261.52652402405 |
| 19 | 96 | 264.694741609701 | -168.694741609701 |
| 20 | 498 | 364.303041189445 | 133.696958810555 |
| 21 | 481 | 345.7104686685 | 135.2895313315 |
| 22 | 468 | 382.249640466583 | 85.7503595334169 |
| 23 | 177 | 286.718659448941 | -109.718659448941 |
| 24 | 198 | 237.915142740667 | -39.9151427406669 |
| 25 | 458 | 271.5549677389 | 186.4450322611 |
| 26 | 108 | 265.504108250617 | -157.504108250617 |
| 27 | 246 | 228.95638103831 | 17.0436189616898 |
| 28 | 291 | 413.746045456084 | -122.746045456084 |
| 29 | 68 | 289.010390127188 | -221.010390127188 |
| 30 | 311 | 346.505826623251 | -35.5058266232515 |
| 31 | 606 | 330.364447011896 | 275.635552988104 |
| 32 | 512 | 529.429214065624 | -17.4292140656245 |
| 33 | 426 | 298.501289817016 | 127.498710182984 |
| 34 | 47 | 207.38841576974 | -160.38841576974 |
| 35 | 265 | 325.202867225694 | -60.2028672256943 |
| 36 | 370 | 270.411424046298 | 99.5885759537016 |
| 37 | 312 | 331.082149725639 | -19.0821497256393 |
| 38 | 222 | 318.263171312261 | -96.2631713122609 |
| 39 | 280 | 293.632200613388 | -13.6322006133883 |
| 40 | 759 | 285.27232915479 | 473.72767084521 |
| 41 | 114 | 215.486295095227 | -101.486295095227 |
| 42 | 419 | 291.262408062247 | 127.737591937753 |
| 43 | 435 | 352.226734903953 | 82.7732650960467 |
| 44 | 186 | 271.143130969781 | -85.1431309697807 |
| 45 | 87 | 250.430042989466 | -163.430042989466 |
| 46 | 188 | 316.275388821138 | -128.275388821138 |
| 47 | 303 | 319.73030457752 | -16.7303045775203 |
| 48 | 102 | 235.872129113482 | -133.872129113482 |
| 49 | 127 | 317.397497032681 | -190.397497032681 |
| 50 | 251 | 325.323303740204 | -74.3233037402043 |
| 51 | 205 | 283.247722677867 | -78.247722677867 |
| 52 | 453 | 318.166049800428 | 134.833950199572 |
| 53 | 320 | 204.871149611947 | 115.128850388053 |
| 54 | 405 | 423.615725106171 | -18.6157251061708 |
| 55 | 89 | 216.956538443007 | -127.956538443007 |
| 56 | 74 | 256.079635020345 | -182.079635020345 |
| 57 | 101 | 271.90516880027 | -170.90516880027 |
| 58 | 321 | 312.577401878429 | 8.42259812157065 |
| 59 | 315 | 496.685940909113 | -181.685940909113 |
| 60 | 229 | 422.872246164992 | -193.872246164992 |
| 61 | 302 | 370.574936414366 | -68.5749364143657 |
| 62 | 216 | 233.883810363485 | -17.8838103634849 |
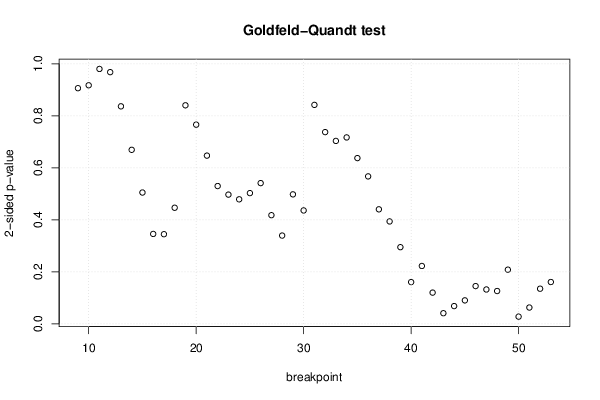
| Goldfeld-Quandt test for Heteroskedasticity | |||
| p-values | Alternative Hypothesis | ||
| breakpoint index | greater | 2-sided | less |
| 9 | 0.546956203774255 | 0.90608759245149 | 0.453043796225745 |
| 10 | 0.458644462296285 | 0.917288924592569 | 0.541355537703715 |
| 11 | 0.490014996268419 | 0.980029992536837 | 0.509985003731581 |
| 12 | 0.516149099883327 | 0.967701800233346 | 0.483850900116673 |
| 13 | 0.418148863891906 | 0.836297727783812 | 0.581851136108094 |
| 14 | 0.334565012687939 | 0.669130025375877 | 0.665434987312062 |
| 15 | 0.252474303394977 | 0.504948606789954 | 0.747525696605023 |
| 16 | 0.17283620702046 | 0.345672414040919 | 0.82716379297954 |
| 17 | 0.172369026407341 | 0.344738052814683 | 0.827630973592659 |
| 18 | 0.223207227723633 | 0.446414455447266 | 0.776792772276367 |
| 19 | 0.420136575323302 | 0.840273150646604 | 0.579863424676698 |
| 20 | 0.382902982034555 | 0.765805964069109 | 0.617097017965445 |
| 21 | 0.323403250549002 | 0.646806501098004 | 0.676596749450998 |
| 22 | 0.264914249293224 | 0.529828498586449 | 0.735085750706776 |
| 23 | 0.248445315510057 | 0.496890631020114 | 0.751554684489943 |
| 24 | 0.239421029525632 | 0.478842059051263 | 0.760578970474368 |
| 25 | 0.251375587559163 | 0.502751175118325 | 0.748624412440837 |
| 26 | 0.27057219421079 | 0.54114438842158 | 0.72942780578921 |
| 27 | 0.208870334493897 | 0.417740668987794 | 0.791129665506103 |
| 28 | 0.169747501521936 | 0.339495003043871 | 0.830252498478064 |
| 29 | 0.248935042072227 | 0.497870084144455 | 0.751064957927773 |
| 30 | 0.218024016573648 | 0.436048033147295 | 0.781975983426352 |
| 31 | 0.420937406891436 | 0.841874813782872 | 0.579062593108564 |
| 32 | 0.368598085801405 | 0.73719617160281 | 0.631401914198595 |
| 33 | 0.351622867642477 | 0.703245735284953 | 0.648377132357523 |
| 34 | 0.358396255756404 | 0.716792511512809 | 0.641603744243596 |
| 35 | 0.318622090745251 | 0.637244181490503 | 0.681377909254749 |
| 36 | 0.283491650151872 | 0.566983300303745 | 0.716508349848128 |
| 37 | 0.220207448456486 | 0.440414896912971 | 0.779792551543514 |
| 38 | 0.196909423563465 | 0.39381884712693 | 0.803090576436535 |
| 39 | 0.14743364390647 | 0.29486728781294 | 0.85256635609353 |
| 40 | 0.919730886071099 | 0.160538227857802 | 0.0802691139289009 |
| 41 | 0.888726766031485 | 0.222546467937029 | 0.111273233968515 |
| 42 | 0.939916200186714 | 0.120167599626573 | 0.0600837998132865 |
| 43 | 0.979524648447842 | 0.040950703104316 | 0.020475351552158 |
| 44 | 0.965814608919935 | 0.0683707821601307 | 0.0341853910800653 |
| 45 | 0.954842381892058 | 0.0903152362158847 | 0.0451576181079424 |
| 46 | 0.927411458741882 | 0.145177082516236 | 0.0725885412581181 |
| 47 | 0.933904318650065 | 0.132191362699871 | 0.0660956813499355 |
| 48 | 0.936856469550696 | 0.126287060898608 | 0.063143530449304 |
| 49 | 0.895837267508966 | 0.208325464982068 | 0.104162732491034 |
| 50 | 0.986140397512286 | 0.0277192049754271 | 0.0138596024877135 |
| 51 | 0.968631257511684 | 0.0627374849766323 | 0.0313687424883162 |
| 52 | 0.932425428078019 | 0.135149143843962 | 0.0675745719219811 |
| 53 | 0.919553515228754 | 0.160892969542493 | 0.0804464847712463 |
| Meta Analysis of Goldfeld-Quandt test for Heteroskedasticity | |||
| Description | # significant tests | % significant tests | OK/NOK |
| 1% type I error level | 0 | 0 | OK |
| 5% type I error level | 2 | 0.0444444444444444 | OK |
| 10% type I error level | 5 | 0.111111111111111 | NOK |