Free Statistics
of Irreproducible Research!
Description of Statistical Computation | |||||||||||||||||||||||||||||||||||||||||||||||||||||||||||||||||||||||||||||||||||||||||||||||||||||||||||||||||||||||||||||||||||||||||||||||||||||||||||||||||||||||||||||||||||||||||||||||||||||||||||||||||||||||||||||||||||||||||||||||||||||||||||||||||||||||||||||||||||||||||||||||||||||||||||||||||||||||||||||||||||||||||||||||||||||||||||||||||||||||||||||||||||||||||||||||||||||
|---|---|---|---|---|---|---|---|---|---|---|---|---|---|---|---|---|---|---|---|---|---|---|---|---|---|---|---|---|---|---|---|---|---|---|---|---|---|---|---|---|---|---|---|---|---|---|---|---|---|---|---|---|---|---|---|---|---|---|---|---|---|---|---|---|---|---|---|---|---|---|---|---|---|---|---|---|---|---|---|---|---|---|---|---|---|---|---|---|---|---|---|---|---|---|---|---|---|---|---|---|---|---|---|---|---|---|---|---|---|---|---|---|---|---|---|---|---|---|---|---|---|---|---|---|---|---|---|---|---|---|---|---|---|---|---|---|---|---|---|---|---|---|---|---|---|---|---|---|---|---|---|---|---|---|---|---|---|---|---|---|---|---|---|---|---|---|---|---|---|---|---|---|---|---|---|---|---|---|---|---|---|---|---|---|---|---|---|---|---|---|---|---|---|---|---|---|---|---|---|---|---|---|---|---|---|---|---|---|---|---|---|---|---|---|---|---|---|---|---|---|---|---|---|---|---|---|---|---|---|---|---|---|---|---|---|---|---|---|---|---|---|---|---|---|---|---|---|---|---|---|---|---|---|---|---|---|---|---|---|---|---|---|---|---|---|---|---|---|---|---|---|---|---|---|---|---|---|---|---|---|---|---|---|---|---|---|---|---|---|---|---|---|---|---|---|---|---|---|---|---|---|---|---|---|---|---|---|---|---|---|---|---|---|---|---|---|---|---|---|---|---|---|---|---|---|---|---|---|---|---|---|---|---|---|---|---|---|---|---|---|---|---|---|---|---|---|---|---|---|---|---|---|---|---|---|---|---|---|---|---|---|---|---|---|---|---|---|---|---|---|---|---|---|---|---|---|---|---|---|---|---|---|---|---|---|---|---|---|---|
| Author's title | |||||||||||||||||||||||||||||||||||||||||||||||||||||||||||||||||||||||||||||||||||||||||||||||||||||||||||||||||||||||||||||||||||||||||||||||||||||||||||||||||||||||||||||||||||||||||||||||||||||||||||||||||||||||||||||||||||||||||||||||||||||||||||||||||||||||||||||||||||||||||||||||||||||||||||||||||||||||||||||||||||||||||||||||||||||||||||||||||||||||||||||||||||||||||||||||||||||
| Author | *The author of this computation has been verified* | ||||||||||||||||||||||||||||||||||||||||||||||||||||||||||||||||||||||||||||||||||||||||||||||||||||||||||||||||||||||||||||||||||||||||||||||||||||||||||||||||||||||||||||||||||||||||||||||||||||||||||||||||||||||||||||||||||||||||||||||||||||||||||||||||||||||||||||||||||||||||||||||||||||||||||||||||||||||||||||||||||||||||||||||||||||||||||||||||||||||||||||||||||||||||||||||||||||
| R Software Module | -- | ||||||||||||||||||||||||||||||||||||||||||||||||||||||||||||||||||||||||||||||||||||||||||||||||||||||||||||||||||||||||||||||||||||||||||||||||||||||||||||||||||||||||||||||||||||||||||||||||||||||||||||||||||||||||||||||||||||||||||||||||||||||||||||||||||||||||||||||||||||||||||||||||||||||||||||||||||||||||||||||||||||||||||||||||||||||||||||||||||||||||||||||||||||||||||||||||||||
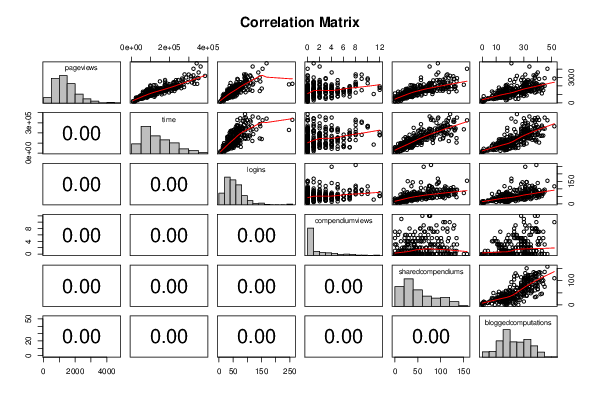
| Title produced by software | Kendall tau Correlation Matrix | ||||||||||||||||||||||||||||||||||||||||||||||||||||||||||||||||||||||||||||||||||||||||||||||||||||||||||||||||||||||||||||||||||||||||||||||||||||||||||||||||||||||||||||||||||||||||||||||||||||||||||||||||||||||||||||||||||||||||||||||||||||||||||||||||||||||||||||||||||||||||||||||||||||||||||||||||||||||||||||||||||||||||||||||||||||||||||||||||||||||||||||||||||||||||||||||||||||
| Date of computation | Fri, 07 Dec 2012 09:36:05 -0500 | ||||||||||||||||||||||||||||||||||||||||||||||||||||||||||||||||||||||||||||||||||||||||||||||||||||||||||||||||||||||||||||||||||||||||||||||||||||||||||||||||||||||||||||||||||||||||||||||||||||||||||||||||||||||||||||||||||||||||||||||||||||||||||||||||||||||||||||||||||||||||||||||||||||||||||||||||||||||||||||||||||||||||||||||||||||||||||||||||||||||||||||||||||||||||||||||||||||
| Cite this page as follows | Statistical Computations at FreeStatistics.org, Office for Research Development and Education, URL https://freestatistics.org/blog/index.php?v=date/2012/Dec/07/t1354890988f33cgzzv2a9ta16.htm/, Retrieved Fri, 19 Apr 2024 13:26:46 +0000 | ||||||||||||||||||||||||||||||||||||||||||||||||||||||||||||||||||||||||||||||||||||||||||||||||||||||||||||||||||||||||||||||||||||||||||||||||||||||||||||||||||||||||||||||||||||||||||||||||||||||||||||||||||||||||||||||||||||||||||||||||||||||||||||||||||||||||||||||||||||||||||||||||||||||||||||||||||||||||||||||||||||||||||||||||||||||||||||||||||||||||||||||||||||||||||||||||||||
| Statistical Computations at FreeStatistics.org, Office for Research Development and Education, URL https://freestatistics.org/blog/index.php?pk=197401, Retrieved Fri, 19 Apr 2024 13:26:46 +0000 | |||||||||||||||||||||||||||||||||||||||||||||||||||||||||||||||||||||||||||||||||||||||||||||||||||||||||||||||||||||||||||||||||||||||||||||||||||||||||||||||||||||||||||||||||||||||||||||||||||||||||||||||||||||||||||||||||||||||||||||||||||||||||||||||||||||||||||||||||||||||||||||||||||||||||||||||||||||||||||||||||||||||||||||||||||||||||||||||||||||||||||||||||||||||||||||||||||||
| QR Codes: | |||||||||||||||||||||||||||||||||||||||||||||||||||||||||||||||||||||||||||||||||||||||||||||||||||||||||||||||||||||||||||||||||||||||||||||||||||||||||||||||||||||||||||||||||||||||||||||||||||||||||||||||||||||||||||||||||||||||||||||||||||||||||||||||||||||||||||||||||||||||||||||||||||||||||||||||||||||||||||||||||||||||||||||||||||||||||||||||||||||||||||||||||||||||||||||||||||||
|
| |||||||||||||||||||||||||||||||||||||||||||||||||||||||||||||||||||||||||||||||||||||||||||||||||||||||||||||||||||||||||||||||||||||||||||||||||||||||||||||||||||||||||||||||||||||||||||||||||||||||||||||||||||||||||||||||||||||||||||||||||||||||||||||||||||||||||||||||||||||||||||||||||||||||||||||||||||||||||||||||||||||||||||||||||||||||||||||||||||||||||||||||||||||||||||||||||||||
| Original text written by user: | |||||||||||||||||||||||||||||||||||||||||||||||||||||||||||||||||||||||||||||||||||||||||||||||||||||||||||||||||||||||||||||||||||||||||||||||||||||||||||||||||||||||||||||||||||||||||||||||||||||||||||||||||||||||||||||||||||||||||||||||||||||||||||||||||||||||||||||||||||||||||||||||||||||||||||||||||||||||||||||||||||||||||||||||||||||||||||||||||||||||||||||||||||||||||||||||||||||
| IsPrivate? | No (this computation is public) | ||||||||||||||||||||||||||||||||||||||||||||||||||||||||||||||||||||||||||||||||||||||||||||||||||||||||||||||||||||||||||||||||||||||||||||||||||||||||||||||||||||||||||||||||||||||||||||||||||||||||||||||||||||||||||||||||||||||||||||||||||||||||||||||||||||||||||||||||||||||||||||||||||||||||||||||||||||||||||||||||||||||||||||||||||||||||||||||||||||||||||||||||||||||||||||||||||||
| User-defined keywords | |||||||||||||||||||||||||||||||||||||||||||||||||||||||||||||||||||||||||||||||||||||||||||||||||||||||||||||||||||||||||||||||||||||||||||||||||||||||||||||||||||||||||||||||||||||||||||||||||||||||||||||||||||||||||||||||||||||||||||||||||||||||||||||||||||||||||||||||||||||||||||||||||||||||||||||||||||||||||||||||||||||||||||||||||||||||||||||||||||||||||||||||||||||||||||||||||||||
| Estimated Impact | 94 | ||||||||||||||||||||||||||||||||||||||||||||||||||||||||||||||||||||||||||||||||||||||||||||||||||||||||||||||||||||||||||||||||||||||||||||||||||||||||||||||||||||||||||||||||||||||||||||||||||||||||||||||||||||||||||||||||||||||||||||||||||||||||||||||||||||||||||||||||||||||||||||||||||||||||||||||||||||||||||||||||||||||||||||||||||||||||||||||||||||||||||||||||||||||||||||||||||||
Tree of Dependent Computations | |||||||||||||||||||||||||||||||||||||||||||||||||||||||||||||||||||||||||||||||||||||||||||||||||||||||||||||||||||||||||||||||||||||||||||||||||||||||||||||||||||||||||||||||||||||||||||||||||||||||||||||||||||||||||||||||||||||||||||||||||||||||||||||||||||||||||||||||||||||||||||||||||||||||||||||||||||||||||||||||||||||||||||||||||||||||||||||||||||||||||||||||||||||||||||||||||||||
| Family? (F = Feedback message, R = changed R code, M = changed R Module, P = changed Parameters, D = changed Data) | |||||||||||||||||||||||||||||||||||||||||||||||||||||||||||||||||||||||||||||||||||||||||||||||||||||||||||||||||||||||||||||||||||||||||||||||||||||||||||||||||||||||||||||||||||||||||||||||||||||||||||||||||||||||||||||||||||||||||||||||||||||||||||||||||||||||||||||||||||||||||||||||||||||||||||||||||||||||||||||||||||||||||||||||||||||||||||||||||||||||||||||||||||||||||||||||||||||
| - [Kendall tau Correlation Matrix] [] [2010-12-05 17:44:33] [b98453cac15ba1066b407e146608df68] - RMPD [Kendall tau Correlation Matrix] [Pearson Correlati...] [2012-12-07 14:05:39] [2bd452e91ac81344e4a11ef6d5439293] - MP [Kendall tau Correlation Matrix] [Pearson Correlati...] [2012-12-07 14:36:05] [e3d79eec5d0d9e3c05706137ffeca8bc] [Current] | |||||||||||||||||||||||||||||||||||||||||||||||||||||||||||||||||||||||||||||||||||||||||||||||||||||||||||||||||||||||||||||||||||||||||||||||||||||||||||||||||||||||||||||||||||||||||||||||||||||||||||||||||||||||||||||||||||||||||||||||||||||||||||||||||||||||||||||||||||||||||||||||||||||||||||||||||||||||||||||||||||||||||||||||||||||||||||||||||||||||||||||||||||||||||||||||||||||
| Feedback Forum | |||||||||||||||||||||||||||||||||||||||||||||||||||||||||||||||||||||||||||||||||||||||||||||||||||||||||||||||||||||||||||||||||||||||||||||||||||||||||||||||||||||||||||||||||||||||||||||||||||||||||||||||||||||||||||||||||||||||||||||||||||||||||||||||||||||||||||||||||||||||||||||||||||||||||||||||||||||||||||||||||||||||||||||||||||||||||||||||||||||||||||||||||||||||||||||||||||||
Post a new message | |||||||||||||||||||||||||||||||||||||||||||||||||||||||||||||||||||||||||||||||||||||||||||||||||||||||||||||||||||||||||||||||||||||||||||||||||||||||||||||||||||||||||||||||||||||||||||||||||||||||||||||||||||||||||||||||||||||||||||||||||||||||||||||||||||||||||||||||||||||||||||||||||||||||||||||||||||||||||||||||||||||||||||||||||||||||||||||||||||||||||||||||||||||||||||||||||||||
Dataset | |||||||||||||||||||||||||||||||||||||||||||||||||||||||||||||||||||||||||||||||||||||||||||||||||||||||||||||||||||||||||||||||||||||||||||||||||||||||||||||||||||||||||||||||||||||||||||||||||||||||||||||||||||||||||||||||||||||||||||||||||||||||||||||||||||||||||||||||||||||||||||||||||||||||||||||||||||||||||||||||||||||||||||||||||||||||||||||||||||||||||||||||||||||||||||||||||||||
| Dataseries X: | |||||||||||||||||||||||||||||||||||||||||||||||||||||||||||||||||||||||||||||||||||||||||||||||||||||||||||||||||||||||||||||||||||||||||||||||||||||||||||||||||||||||||||||||||||||||||||||||||||||||||||||||||||||||||||||||||||||||||||||||||||||||||||||||||||||||||||||||||||||||||||||||||||||||||||||||||||||||||||||||||||||||||||||||||||||||||||||||||||||||||||||||||||||||||||||||||||||
1418 210907 56 3 79 30 869 120982 56 4 58 28 1530 176508 54 12 60 38 2172 179321 89 2 108 30 901 123185 40 1 49 22 463 52746 25 3 0 26 3201 385534 92 0 121 25 371 33170 18 0 1 18 1192 101645 63 0 20 11 1583 149061 44 5 43 26 1439 165446 33 0 69 25 1764 237213 84 0 78 38 1495 173326 88 7 86 44 1373 133131 55 7 44 30 2187 258873 60 3 104 40 1491 180083 66 9 63 34 4041 324799 154 0 158 47 1706 230964 53 4 102 30 2152 236785 119 3 77 31 1036 135473 41 0 82 23 1882 202925 61 7 115 36 1929 215147 58 0 101 36 2242 344297 75 1 80 30 1220 153935 33 5 50 25 1289 132943 40 7 83 39 2515 174724 92 0 123 34 2147 174415 100 0 73 31 2352 225548 112 5 81 31 1638 223632 73 0 105 33 1222 124817 40 0 47 25 1812 221698 45 0 105 33 1677 210767 60 3 94 35 1579 170266 62 4 44 42 1731 260561 75 1 114 43 807 84853 31 4 38 30 2452 294424 77 2 107 33 829 101011 34 0 30 13 1940 215641 46 0 71 32 2662 325107 99 0 84 36 186 7176 17 0 0 0 1499 167542 66 2 59 28 865 106408 30 1 33 14 1793 96560 76 0 42 17 2527 265769 146 2 96 32 2747 269651 67 10 106 30 1324 149112 56 6 56 35 2702 175824 107 0 57 20 1383 152871 58 5 59 28 1179 111665 34 4 39 28 2099 116408 61 1 34 39 4308 362301 119 2 76 34 918 78800 42 2 20 26 1831 183167 66 0 91 39 3373 277965 89 8 115 39 1713 150629 44 3 85 33 1438 168809 66 0 76 28 496 24188 24 0 8 4 2253 329267 259 8 79 39 744 65029 17 5 21 18 1161 101097 64 3 30 14 2352 218946 41 1 76 29 2144 244052 68 5 101 44 4691 341570 168 1 94 21 1112 103597 43 1 27 16 2694 233328 132 5 92 28 1973 256462 105 0 123 35 1769 206161 71 12 75 28 3148 311473 112 8 128 38 2474 235800 94 8 105 23 2084 177939 82 8 55 36 1954 207176 70 8 56 32 1226 196553 57 2 41 29 1389 174184 53 0 72 25 1496 143246 103 5 67 27 2269 187559 121 8 75 36 1833 187681 62 2 114 28 1268 119016 52 5 118 23 1943 182192 52 12 77 40 893 73566 32 6 22 23 1762 194979 62 7 66 40 1403 167488 45 2 69 28 1425 143756 46 0 105 34 1857 275541 63 4 116 33 1840 243199 75 3 88 28 1502 182999 88 6 73 34 1441 135649 46 2 99 30 1420 152299 53 0 62 33 1416 120221 37 1 53 22 2970 346485 90 0 118 38 1317 145790 63 5 30 26 1644 193339 78 2 100 35 870 80953 25 0 49 8 1654 122774 45 0 24 24 1054 130585 46 5 67 29 937 112611 41 0 46 20 3004 286468 144 1 57 29 2008 241066 82 0 75 45 2547 148446 91 1 135 37 1885 204713 71 1 68 33 1626 182079 63 2 124 33 1468 140344 53 6 33 25 2445 220516 62 1 98 32 1964 243060 63 4 58 29 1381 162765 32 2 68 28 1369 182613 39 3 81 28 1659 232138 62 0 131 31 2888 265318 117 10 110 52 1290 85574 34 0 37 21 2845 310839 92 9 130 24 1982 225060 93 7 93 41 1904 232317 54 0 118 33 1391 144966 144 0 39 32 602 43287 14 4 13 19 1743 155754 61 4 74 20 1559 164709 109 0 81 31 2014 201940 38 0 109 31 2143 235454 73 0 151 32 2146 220801 75 1 51 18 874 99466 50 0 28 23 1590 92661 61 1 40 17 1590 133328 55 0 56 20 1210 61361 77 0 27 12 2072 125930 75 4 37 17 1281 100750 72 0 83 30 1401 224549 50 4 54 31 834 82316 32 4 27 10 1105 102010 53 3 28 13 1272 101523 42 0 59 22 1944 243511 71 0 133 42 391 22938 10 0 12 1 761 41566 35 5 0 9 1605 152474 65 0 106 32 530 61857 25 4 23 11 1988 99923 66 0 44 25 1386 132487 41 0 71 36 2395 317394 86 1 116 31 387 21054 16 0 4 0 1742 209641 42 5 62 24 620 22648 19 0 12 13 449 31414 19 0 18 8 800 46698 45 0 14 13 1684 131698 65 0 60 19 1050 91735 35 0 7 18 2699 244749 95 2 98 33 1606 184510 49 7 64 40 1502 79863 37 1 29 22 1204 128423 64 8 32 38 1138 97839 38 2 25 24 568 38214 34 0 16 8 1459 151101 32 2 48 35 2158 272458 65 0 100 43 1111 172494 52 0 46 43 1421 108043 62 1 45 14 2833 328107 65 3 129 41 1955 250579 83 0 130 38 2922 351067 95 3 136 45 1002 158015 29 0 59 31 1060 98866 18 0 25 13 956 85439 33 0 32 28 2186 229242 247 4 63 31 3604 351619 139 4 95 40 1035 84207 29 11 14 30 1417 120445 118 0 36 16 3261 324598 110 0 113 37 1587 131069 67 4 47 30 1424 204271 42 0 92 35 1701 165543 65 1 70 32 1249 141722 94 0 19 27 946 116048 64 0 50 20 1926 250047 81 0 41 18 3352 299775 95 9 91 31 1641 195838 67 1 111 31 2035 173260 63 3 41 21 2312 254488 83 10 120 39 1369 104389 45 5 135 41 1577 136084 30 0 27 13 2201 199476 70 2 87 32 961 92499 32 0 25 18 1900 224330 83 1 131 39 1254 135781 31 2 45 14 1335 74408 67 4 29 7 1597 81240 66 0 58 17 207 14688 10 0 4 0 1645 181633 70 2 47 30 2429 271856 103 1 109 37 151 7199 5 0 7 0 474 46660 20 0 12 5 141 17547 5 0 0 1 1639 133368 36 1 37 16 872 95227 34 0 37 32 1318 152601 48 2 46 24 1018 98146 40 0 15 17 1383 79619 43 3 42 11 1314 59194 31 6 7 24 1335 139942 42 0 54 22 1403 118612 46 2 54 12 910 72880 33 0 14 19 616 65475 18 2 16 13 1407 99643 55 1 33 17 771 71965 35 1 32 15 766 77272 59 2 21 16 473 49289 19 1 15 24 1376 135131 66 0 38 15 1232 108446 60 1 22 17 1521 89746 36 3 28 18 572 44296 25 0 10 20 1059 77648 47 0 31 16 1544 181528 54 0 32 16 1230 134019 53 0 32 18 1206 124064 40 1 43 22 1205 92630 40 4 27 8 1255 121848 39 0 37 17 613 52915 14 0 20 18 721 81872 45 0 32 16 1109 58981 36 7 0 23 740 53515 28 2 5 22 1126 60812 44 0 26 13 728 56375 30 7 10 13 689 65490 22 3 27 16 592 80949 17 0 11 16 995 76302 31 0 29 20 1613 104011 55 6 25 22 2048 98104 54 2 55 17 705 67989 21 0 23 18 301 30989 14 0 5 17 1803 135458 81 3 43 12 799 73504 35 0 23 7 861 63123 43 1 34 17 1186 61254 46 1 36 14 1451 74914 30 0 35 23 628 31774 23 1 0 17 1161 81437 38 0 37 14 1463 87186 54 0 28 15 742 50090 20 0 16 17 979 65745 53 0 26 21 675 56653 45 0 38 18 1241 158399 39 0 23 18 676 46455 20 0 22 17 1049 73624 24 0 30 17 620 38395 31 0 16 16 1081 91899 35 0 18 15 1688 139526 151 0 28 21 736 52164 52 0 32 16 617 51567 30 2 21 14 812 70551 31 0 23 15 1051 84856 29 1 29 17 1656 102538 57 1 50 15 705 86678 40 0 12 15 945 85709 44 0 21 10 554 34662 25 0 18 6 1597 150580 77 0 27 22 982 99611 35 0 41 21 222 19349 11 0 13 1 1212 99373 63 1 12 18 1143 86230 44 0 21 17 435 30837 19 0 8 4 532 31706 13 0 26 10 882 89806 42 0 27 16 608 62088 38 1 13 16 459 40151 29 0 16 9 578 27634 20 0 2 16 826 76990 27 0 42 17 509 37460 20 0 5 7 717 54157 19 0 37 15 637 49862 37 0 17 14 857 84337 26 0 38 14 830 64175 42 0 37 18 652 59382 49 0 29 12 707 119308 30 0 32 16 954 76702 49 0 35 21 1461 103425 67 1 17 19 672 70344 28 0 20 16 778 43410 19 0 7 1 1141 104838 49 1 46 16 680 62215 27 0 24 10 1090 69304 30 6 40 19 616 53117 22 3 3 12 285 19764 12 1 10 2 1145 86680 31 2 37 14 733 84105 20 0 17 17 888 77945 20 0 28 19 849 89113 39 0 19 14 1182 91005 29 3 29 11 528 40248 16 1 8 4 642 64187 27 0 10 16 947 50857 21 0 15 20 819 56613 19 1 15 12 757 62792 35 0 28 15 894 72535 14 0 17 16 | |||||||||||||||||||||||||||||||||||||||||||||||||||||||||||||||||||||||||||||||||||||||||||||||||||||||||||||||||||||||||||||||||||||||||||||||||||||||||||||||||||||||||||||||||||||||||||||||||||||||||||||||||||||||||||||||||||||||||||||||||||||||||||||||||||||||||||||||||||||||||||||||||||||||||||||||||||||||||||||||||||||||||||||||||||||||||||||||||||||||||||||||||||||||||||||||||||||
Tables (Output of Computation) | |||||||||||||||||||||||||||||||||||||||||||||||||||||||||||||||||||||||||||||||||||||||||||||||||||||||||||||||||||||||||||||||||||||||||||||||||||||||||||||||||||||||||||||||||||||||||||||||||||||||||||||||||||||||||||||||||||||||||||||||||||||||||||||||||||||||||||||||||||||||||||||||||||||||||||||||||||||||||||||||||||||||||||||||||||||||||||||||||||||||||||||||||||||||||||||||||||||
| |||||||||||||||||||||||||||||||||||||||||||||||||||||||||||||||||||||||||||||||||||||||||||||||||||||||||||||||||||||||||||||||||||||||||||||||||||||||||||||||||||||||||||||||||||||||||||||||||||||||||||||||||||||||||||||||||||||||||||||||||||||||||||||||||||||||||||||||||||||||||||||||||||||||||||||||||||||||||||||||||||||||||||||||||||||||||||||||||||||||||||||||||||||||||||||||||||||
Figures (Output of Computation) | |||||||||||||||||||||||||||||||||||||||||||||||||||||||||||||||||||||||||||||||||||||||||||||||||||||||||||||||||||||||||||||||||||||||||||||||||||||||||||||||||||||||||||||||||||||||||||||||||||||||||||||||||||||||||||||||||||||||||||||||||||||||||||||||||||||||||||||||||||||||||||||||||||||||||||||||||||||||||||||||||||||||||||||||||||||||||||||||||||||||||||||||||||||||||||||||||||||
Input Parameters & R Code | |||||||||||||||||||||||||||||||||||||||||||||||||||||||||||||||||||||||||||||||||||||||||||||||||||||||||||||||||||||||||||||||||||||||||||||||||||||||||||||||||||||||||||||||||||||||||||||||||||||||||||||||||||||||||||||||||||||||||||||||||||||||||||||||||||||||||||||||||||||||||||||||||||||||||||||||||||||||||||||||||||||||||||||||||||||||||||||||||||||||||||||||||||||||||||||||||||||
| Parameters (Session): | |||||||||||||||||||||||||||||||||||||||||||||||||||||||||||||||||||||||||||||||||||||||||||||||||||||||||||||||||||||||||||||||||||||||||||||||||||||||||||||||||||||||||||||||||||||||||||||||||||||||||||||||||||||||||||||||||||||||||||||||||||||||||||||||||||||||||||||||||||||||||||||||||||||||||||||||||||||||||||||||||||||||||||||||||||||||||||||||||||||||||||||||||||||||||||||||||||||
| par1 = 2 ; par2 = none ; par3 = 3 ; par4 = no ; | |||||||||||||||||||||||||||||||||||||||||||||||||||||||||||||||||||||||||||||||||||||||||||||||||||||||||||||||||||||||||||||||||||||||||||||||||||||||||||||||||||||||||||||||||||||||||||||||||||||||||||||||||||||||||||||||||||||||||||||||||||||||||||||||||||||||||||||||||||||||||||||||||||||||||||||||||||||||||||||||||||||||||||||||||||||||||||||||||||||||||||||||||||||||||||||||||||||
| Parameters (R input): | |||||||||||||||||||||||||||||||||||||||||||||||||||||||||||||||||||||||||||||||||||||||||||||||||||||||||||||||||||||||||||||||||||||||||||||||||||||||||||||||||||||||||||||||||||||||||||||||||||||||||||||||||||||||||||||||||||||||||||||||||||||||||||||||||||||||||||||||||||||||||||||||||||||||||||||||||||||||||||||||||||||||||||||||||||||||||||||||||||||||||||||||||||||||||||||||||||||
| par1 = kendall ; par2 = ; par3 = ; par4 = ; par5 = ; par6 = ; par7 = ; par8 = ; par9 = ; par10 = ; par11 = ; par12 = ; par13 = ; par14 = ; par15 = ; par16 = ; par17 = ; par18 = ; par19 = ; par20 = ; | |||||||||||||||||||||||||||||||||||||||||||||||||||||||||||||||||||||||||||||||||||||||||||||||||||||||||||||||||||||||||||||||||||||||||||||||||||||||||||||||||||||||||||||||||||||||||||||||||||||||||||||||||||||||||||||||||||||||||||||||||||||||||||||||||||||||||||||||||||||||||||||||||||||||||||||||||||||||||||||||||||||||||||||||||||||||||||||||||||||||||||||||||||||||||||||||||||||
| R code (references can be found in the software module): | |||||||||||||||||||||||||||||||||||||||||||||||||||||||||||||||||||||||||||||||||||||||||||||||||||||||||||||||||||||||||||||||||||||||||||||||||||||||||||||||||||||||||||||||||||||||||||||||||||||||||||||||||||||||||||||||||||||||||||||||||||||||||||||||||||||||||||||||||||||||||||||||||||||||||||||||||||||||||||||||||||||||||||||||||||||||||||||||||||||||||||||||||||||||||||||||||||||
panel.tau <- function(x, y, digits=2, prefix='', cex.cor) | |||||||||||||||||||||||||||||||||||||||||||||||||||||||||||||||||||||||||||||||||||||||||||||||||||||||||||||||||||||||||||||||||||||||||||||||||||||||||||||||||||||||||||||||||||||||||||||||||||||||||||||||||||||||||||||||||||||||||||||||||||||||||||||||||||||||||||||||||||||||||||||||||||||||||||||||||||||||||||||||||||||||||||||||||||||||||||||||||||||||||||||||||||||||||||||||||||||