Free Statistics
of Irreproducible Research!
Description of Statistical Computation | |||||||||||||||||||||||||||||||||||||||||||||||||||||||||||||||||||||||||||||||||||||||||||||||||||||||||||||||||||||||||||||||||||||||||||||||||||||||||||||||||||||||||||||||||||||||||||||||||
|---|---|---|---|---|---|---|---|---|---|---|---|---|---|---|---|---|---|---|---|---|---|---|---|---|---|---|---|---|---|---|---|---|---|---|---|---|---|---|---|---|---|---|---|---|---|---|---|---|---|---|---|---|---|---|---|---|---|---|---|---|---|---|---|---|---|---|---|---|---|---|---|---|---|---|---|---|---|---|---|---|---|---|---|---|---|---|---|---|---|---|---|---|---|---|---|---|---|---|---|---|---|---|---|---|---|---|---|---|---|---|---|---|---|---|---|---|---|---|---|---|---|---|---|---|---|---|---|---|---|---|---|---|---|---|---|---|---|---|---|---|---|---|---|---|---|---|---|---|---|---|---|---|---|---|---|---|---|---|---|---|---|---|---|---|---|---|---|---|---|---|---|---|---|---|---|---|---|---|---|---|---|---|---|---|---|---|---|---|---|---|---|---|---|
| Author's title | |||||||||||||||||||||||||||||||||||||||||||||||||||||||||||||||||||||||||||||||||||||||||||||||||||||||||||||||||||||||||||||||||||||||||||||||||||||||||||||||||||||||||||||||||||||||||||||||||
| Author | *The author of this computation has been verified* | ||||||||||||||||||||||||||||||||||||||||||||||||||||||||||||||||||||||||||||||||||||||||||||||||||||||||||||||||||||||||||||||||||||||||||||||||||||||||||||||||||||||||||||||||||||||||||||||||
| R Software Module | -- | ||||||||||||||||||||||||||||||||||||||||||||||||||||||||||||||||||||||||||||||||||||||||||||||||||||||||||||||||||||||||||||||||||||||||||||||||||||||||||||||||||||||||||||||||||||||||||||||||
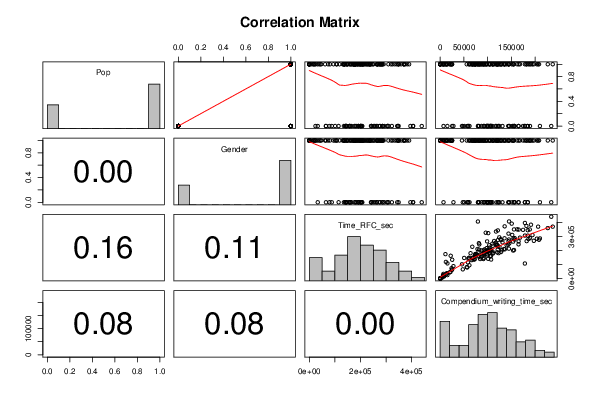
| Title produced by software | Kendall tau Correlation Matrix | ||||||||||||||||||||||||||||||||||||||||||||||||||||||||||||||||||||||||||||||||||||||||||||||||||||||||||||||||||||||||||||||||||||||||||||||||||||||||||||||||||||||||||||||||||||||||||||||||
| Date of computation | Fri, 07 Dec 2012 08:48:13 -0500 | ||||||||||||||||||||||||||||||||||||||||||||||||||||||||||||||||||||||||||||||||||||||||||||||||||||||||||||||||||||||||||||||||||||||||||||||||||||||||||||||||||||||||||||||||||||||||||||||||
| Cite this page as follows | Statistical Computations at FreeStatistics.org, Office for Research Development and Education, URL https://freestatistics.org/blog/index.php?v=date/2012/Dec/07/t13548881085je34vmj3gc7ypd.htm/, Retrieved Fri, 19 Apr 2024 03:28:13 +0000 | ||||||||||||||||||||||||||||||||||||||||||||||||||||||||||||||||||||||||||||||||||||||||||||||||||||||||||||||||||||||||||||||||||||||||||||||||||||||||||||||||||||||||||||||||||||||||||||||||
| Statistical Computations at FreeStatistics.org, Office for Research Development and Education, URL https://freestatistics.org/blog/index.php?pk=197371, Retrieved Fri, 19 Apr 2024 03:28:13 +0000 | |||||||||||||||||||||||||||||||||||||||||||||||||||||||||||||||||||||||||||||||||||||||||||||||||||||||||||||||||||||||||||||||||||||||||||||||||||||||||||||||||||||||||||||||||||||||||||||||||
| QR Codes: | |||||||||||||||||||||||||||||||||||||||||||||||||||||||||||||||||||||||||||||||||||||||||||||||||||||||||||||||||||||||||||||||||||||||||||||||||||||||||||||||||||||||||||||||||||||||||||||||||
|
| |||||||||||||||||||||||||||||||||||||||||||||||||||||||||||||||||||||||||||||||||||||||||||||||||||||||||||||||||||||||||||||||||||||||||||||||||||||||||||||||||||||||||||||||||||||||||||||||||
| Original text written by user: | |||||||||||||||||||||||||||||||||||||||||||||||||||||||||||||||||||||||||||||||||||||||||||||||||||||||||||||||||||||||||||||||||||||||||||||||||||||||||||||||||||||||||||||||||||||||||||||||||
| IsPrivate? | No (this computation is public) | ||||||||||||||||||||||||||||||||||||||||||||||||||||||||||||||||||||||||||||||||||||||||||||||||||||||||||||||||||||||||||||||||||||||||||||||||||||||||||||||||||||||||||||||||||||||||||||||||
| User-defined keywords | |||||||||||||||||||||||||||||||||||||||||||||||||||||||||||||||||||||||||||||||||||||||||||||||||||||||||||||||||||||||||||||||||||||||||||||||||||||||||||||||||||||||||||||||||||||||||||||||||
| Estimated Impact | 116 | ||||||||||||||||||||||||||||||||||||||||||||||||||||||||||||||||||||||||||||||||||||||||||||||||||||||||||||||||||||||||||||||||||||||||||||||||||||||||||||||||||||||||||||||||||||||||||||||||
Tree of Dependent Computations | |||||||||||||||||||||||||||||||||||||||||||||||||||||||||||||||||||||||||||||||||||||||||||||||||||||||||||||||||||||||||||||||||||||||||||||||||||||||||||||||||||||||||||||||||||||||||||||||||
| Family? (F = Feedback message, R = changed R code, M = changed R Module, P = changed Parameters, D = changed Data) | |||||||||||||||||||||||||||||||||||||||||||||||||||||||||||||||||||||||||||||||||||||||||||||||||||||||||||||||||||||||||||||||||||||||||||||||||||||||||||||||||||||||||||||||||||||||||||||||||
| - [Kendall tau Correlation Matrix] [] [2010-12-05 18:04:16] [b98453cac15ba1066b407e146608df68] - RMPD [Kendall tau Correlation Matrix] [] [2011-12-11 12:47:57] [b4c8fd31b0af00c33711722ddf8d2c4c] - PD [Kendall tau Correlation Matrix] [] [2011-12-11 13:35:32] [b4c8fd31b0af00c33711722ddf8d2c4c] - D [Kendall tau Correlation Matrix] [] [2011-12-11 14:09:21] [b4c8fd31b0af00c33711722ddf8d2c4c] - PD [Kendall tau Correlation Matrix] [] [2011-12-12 10:00:02] [74be16979710d4c4e7c6647856088456] - [Kendall tau Correlation Matrix] [] [2011-12-12 10:02:56] [74be16979710d4c4e7c6647856088456] - M [Kendall tau Correlation Matrix] [WS 10] [2012-12-07 13:48:13] [f4c84c9faf29e2061c3a475b218c0eb5] [Current] | |||||||||||||||||||||||||||||||||||||||||||||||||||||||||||||||||||||||||||||||||||||||||||||||||||||||||||||||||||||||||||||||||||||||||||||||||||||||||||||||||||||||||||||||||||||||||||||||||
| Feedback Forum | |||||||||||||||||||||||||||||||||||||||||||||||||||||||||||||||||||||||||||||||||||||||||||||||||||||||||||||||||||||||||||||||||||||||||||||||||||||||||||||||||||||||||||||||||||||||||||||||||
Post a new message | |||||||||||||||||||||||||||||||||||||||||||||||||||||||||||||||||||||||||||||||||||||||||||||||||||||||||||||||||||||||||||||||||||||||||||||||||||||||||||||||||||||||||||||||||||||||||||||||||
Dataset | |||||||||||||||||||||||||||||||||||||||||||||||||||||||||||||||||||||||||||||||||||||||||||||||||||||||||||||||||||||||||||||||||||||||||||||||||||||||||||||||||||||||||||||||||||||||||||||||||
| Dataseries X: | |||||||||||||||||||||||||||||||||||||||||||||||||||||||||||||||||||||||||||||||||||||||||||||||||||||||||||||||||||||||||||||||||||||||||||||||||||||||||||||||||||||||||||||||||||||||||||||||||
0 0 264530 165119 0 0 135248 107269 0 0 207253 93497 0 0 202898 100269 0 0 145249 91627 0 0 65295 47552 0 0 439387 233933 0 0 33186 6853 0 0 183696 104380 0 0 190673 98431 0 0 287239 156949 0 0 205260 81817 0 0 141987 59238 0 0 322679 101138 0 0 199717 107158 0 0 349227 155499 0 0 276709 156274 0 0 273576 121777 0 0 157448 105037 0 0 242782 118661 0 0 256814 131187 0 0 405874 145026 0 0 161189 107016 0 0 156189 87242 0 0 200181 91699 0 0 192645 110087 0 0 249893 145447 0 0 241171 143307 0 0 143182 61678 0 0 285266 210080 0 0 243048 165005 0 0 176062 97806 0 0 305210 184471 0 0 87995 27786 0 0 343613 184458 0 0 264159 98765 0 0 394976 178441 0 0 192718 100619 0 0 114673 58391 0 0 310108 151672 0 0 292891 124437 0 0 157518 79929 0 0 180362 123064 0 0 146175 50466 0 0 140319 100991 0 0 405267 79367 0 0 78800 56968 0 0 201970 106257 0 0 305322 178412 0 0 164733 98520 0 1 199186 153670 0 1 24188 15049 0 1 346142 174478 0 1 65029 25109 0 1 101097 45824 0 1 255082 116772 0 1 287314 189150 1 1 308944 194404 1 1 280943 185881 1 1 225816 67508 1 1 348943 188597 1 1 283283 203618 1 1 199642 87232 1 1 232791 110875 1 1 212262 144756 1 1 201345 129825 1 1 180424 92189 1 1 204450 121158 1 1 197813 96219 1 1 138731 84128 1 1 216153 97960 1 1 73566 23824 1 1 219392 103515 1 1 181728 91313 1 1 150006 85407 1 1 325723 95871 1 1 265348 143846 1 1 202410 155387 1 1 173420 74429 1 1 162366 74004 1 1 136341 71987 1 1 390163 150629 1 1 145905 68580 1 1 238921 119855 1 1 80953 55792 1 1 133301 25157 1 1 138630 90895 1 1 334082 117510 1 1 277542 144774 1 1 170849 77529 1 1 236398 103123 1 1 207178 104669 1 1 157125 82414 1 1 242395 82390 1 1 273632 128446 1 1 178489 111542 1 1 207720 136048 1 1 268066 197257 1 1 349934 162079 1 1 368833 206286 1 1 247804 109858 1 1 265849 182125 1 1 174311 74168 1 1 43287 19630 1 1 176724 88634 1 1 189021 128321 1 1 237531 118936 1 1 279589 127044 1 1 106655 178377 1 1 135798 69581 1 1 290495 168019 1 1 266805 113598 1 1 23623 5841 1 1 174970 93116 1 1 61857 24610 1 1 147760 60611 1 1 358662 226620 1 1 21054 6622 1 1 230091 121996 1 1 31414 13155 1 1 284519 154158 1 1 209481 78489 1 1 161691 22007 1 1 137093 72530 1 1 38214 13983 1 1 166059 73397 1 1 319346 143878 1 1 186273 119956 1 1 374212 181558 1 1 275578 208236 1 1 368863 237085 1 1 179928 110297 1 1 94381 61394 1 1 251253 81420 1 1 382564 191154 1 1 118033 11798 1 1 370878 135724 1 1 147989 68614 1 1 236370 139926 1 1 193220 105203 1 1 189020 80338 1 1 341992 121376 1 1 224936 124922 1 1 173260 10901 1 1 286161 135471 1 1 130908 66395 1 1 209639 134041 1 1 262412 153554 1 1 1 0 1 1 14688 7953 1 1 98 0 1 1 455 0 1 1 0 0 1 1 0 0 1 1 195822 98922 1 1 347930 165395 1 1 0 0 1 1 203 0 1 1 7199 4245 1 1 46660 21509 1 1 17547 7670 1 1 107465 15167 1 1 969 0 1 1 179994 63891 | |||||||||||||||||||||||||||||||||||||||||||||||||||||||||||||||||||||||||||||||||||||||||||||||||||||||||||||||||||||||||||||||||||||||||||||||||||||||||||||||||||||||||||||||||||||||||||||||||
Tables (Output of Computation) | |||||||||||||||||||||||||||||||||||||||||||||||||||||||||||||||||||||||||||||||||||||||||||||||||||||||||||||||||||||||||||||||||||||||||||||||||||||||||||||||||||||||||||||||||||||||||||||||||
| |||||||||||||||||||||||||||||||||||||||||||||||||||||||||||||||||||||||||||||||||||||||||||||||||||||||||||||||||||||||||||||||||||||||||||||||||||||||||||||||||||||||||||||||||||||||||||||||||
Figures (Output of Computation) | |||||||||||||||||||||||||||||||||||||||||||||||||||||||||||||||||||||||||||||||||||||||||||||||||||||||||||||||||||||||||||||||||||||||||||||||||||||||||||||||||||||||||||||||||||||||||||||||||
Input Parameters & R Code | |||||||||||||||||||||||||||||||||||||||||||||||||||||||||||||||||||||||||||||||||||||||||||||||||||||||||||||||||||||||||||||||||||||||||||||||||||||||||||||||||||||||||||||||||||||||||||||||||
| Parameters (Session): | |||||||||||||||||||||||||||||||||||||||||||||||||||||||||||||||||||||||||||||||||||||||||||||||||||||||||||||||||||||||||||||||||||||||||||||||||||||||||||||||||||||||||||||||||||||||||||||||||
| par1 = kendall ; | |||||||||||||||||||||||||||||||||||||||||||||||||||||||||||||||||||||||||||||||||||||||||||||||||||||||||||||||||||||||||||||||||||||||||||||||||||||||||||||||||||||||||||||||||||||||||||||||||
| Parameters (R input): | |||||||||||||||||||||||||||||||||||||||||||||||||||||||||||||||||||||||||||||||||||||||||||||||||||||||||||||||||||||||||||||||||||||||||||||||||||||||||||||||||||||||||||||||||||||||||||||||||
| par1 = kendall ; par2 = ; par3 = ; par4 = ; par5 = ; par6 = ; par7 = ; par8 = ; par9 = ; par10 = ; par11 = ; par12 = ; par13 = ; par14 = ; par15 = ; par16 = ; par17 = ; par18 = ; par19 = ; par20 = ; | |||||||||||||||||||||||||||||||||||||||||||||||||||||||||||||||||||||||||||||||||||||||||||||||||||||||||||||||||||||||||||||||||||||||||||||||||||||||||||||||||||||||||||||||||||||||||||||||||
| R code (references can be found in the software module): | |||||||||||||||||||||||||||||||||||||||||||||||||||||||||||||||||||||||||||||||||||||||||||||||||||||||||||||||||||||||||||||||||||||||||||||||||||||||||||||||||||||||||||||||||||||||||||||||||
panel.tau <- function(x, y, digits=2, prefix='', cex.cor) | |||||||||||||||||||||||||||||||||||||||||||||||||||||||||||||||||||||||||||||||||||||||||||||||||||||||||||||||||||||||||||||||||||||||||||||||||||||||||||||||||||||||||||||||||||||||||||||||||