| Multiple Linear Regression - Estimated Regression Equation |
| totaal[t] = + 7894.10784642673 -5984937.24205833jaar[t] -4.24806024091576pop[t] + 1.01189721469291pop_t[t] + 0.9963217503198totaal_vlaams_gewest[t] -1.01362201275628pop_vlaams_gewest[t] + 1.0016672443557totaal_waals_gewest[t] -1.00684777277755waals_gewest_pop[t] + 1.0069404337548totaal_brussel[t] -1.01428104293863totaal_brussel_pop[t] -3.85083594364875t + e[t] |
| Multiple Linear Regression - Ordinary Least Squares | |||||
| Variable | Parameter | S.D. | T-STAT H0: parameter = 0 | 2-tail p-value | 1-tail p-value |
| (Intercept) | 7894.10784642673 | 9225.940188 | 0.8556 | 0.397422 | 0.198711 |
| jaar | -5984937.24205833 | 6995127.030118 | -0.8556 | 0.397453 | 0.198726 |
| pop | -4.24806024091576 | 6.357135 | -0.6682 | 0.507919 | 0.25396 |
| pop_t | 1.01189721469291 | 0.140787 | 7.1874 | 0 | 0 |
| totaal_vlaams_gewest | 0.9963217503198 | 0.007083 | 140.6683 | 0 | 0 |
| pop_vlaams_gewest | -1.01362201275628 | 0.141265 | -7.1753 | 0 | 0 |
| totaal_waals_gewest | 1.0016672443557 | 0.008569 | 116.8978 | 0 | 0 |
| waals_gewest_pop | -1.00684777277755 | 0.139649 | -7.2098 | 0 | 0 |
| totaal_brussel | 1.0069404337548 | 0.006875 | 146.4567 | 0 | 0 |
| totaal_brussel_pop | -1.01428104293863 | 0.141528 | -7.1666 | 0 | 0 |
| t | -3.85083594364875 | 4.485331 | -0.8585 | 0.39584 | 0.19792 |
| Multiple Linear Regression - Regression Statistics | |
| Multiple R | 0.999999510190234 |
| R-squared | 0.999999020380709 |
| Adjusted R-squared | 0.999998769196275 |
| F-TEST (value) | 3981134.52199187 |
| F-TEST (DF numerator) | 10 |
| F-TEST (DF denominator) | 39 |
| p-value | 0 |
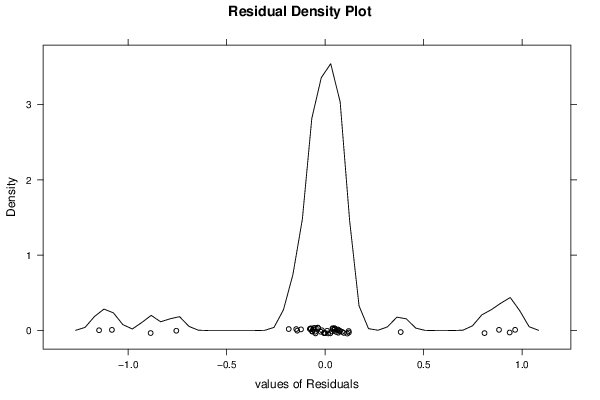
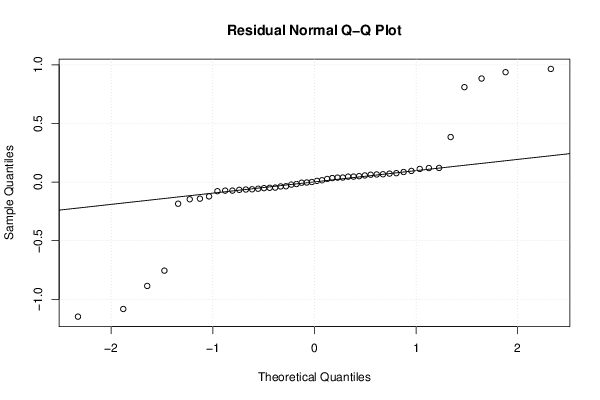
| Multiple Linear Regression - Residual Statistics | |
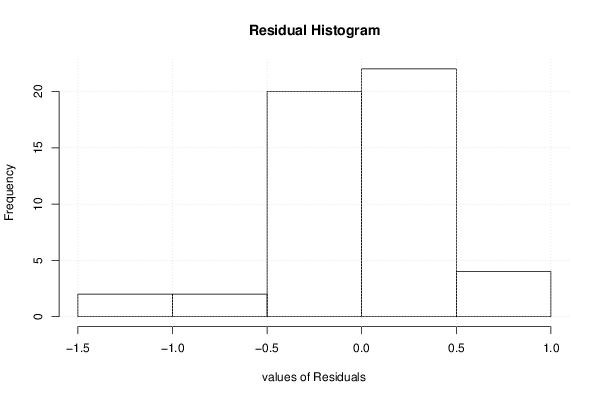
| Residual Standard Deviation | 0.437535099511172 |
| Sum Squared Residuals | 7.46604156886578 |
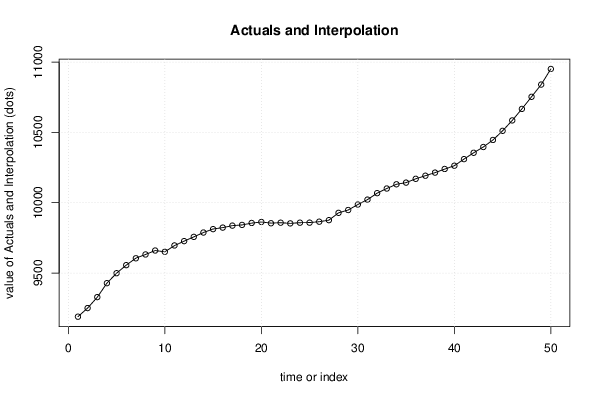
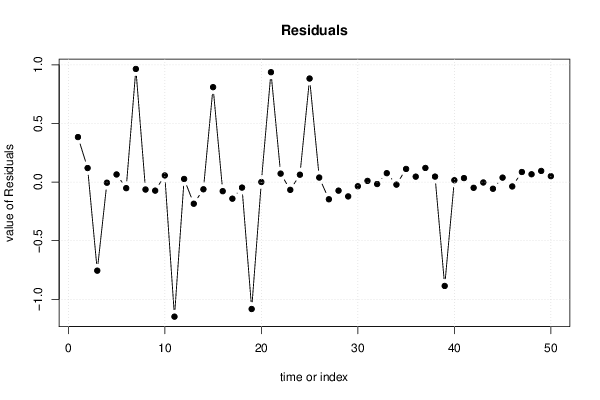
| Multiple Linear Regression - Actuals, Interpolation, and Residuals | |||
| Time or Index | Actuals | Interpolation Forecast | Residuals Prediction Error |
| 1 | 9190 | 9189.61633228754 | 0.383667712462962 |
| 2 | 9251 | 9250.88052512543 | 0.119474874574835 |
| 3 | 9328 | 9328.75570797645 | -0.755707976451846 |
| 4 | 9428 | 9428.00570681055 | -0.00570681055099114 |
| 5 | 9499 | 9498.93525565056 | 0.0647443494389326 |
| 6 | 9556 | 9556.05200085409 | -0.052000854087941 |
| 7 | 9606 | 9605.0354292213 | 0.964570778701347 |
| 8 | 9632 | 9632.06382440263 | -0.0638244026303742 |
| 9 | 9660 | 9660.07311317991 | -0.0731131799065256 |
| 10 | 9651 | 9650.94364269509 | 0.0563573049093331 |
| 11 | 9695 | 9696.1479383461 | -1.1479383460985 |
| 12 | 9727 | 9726.97367975042 | 0.0263202495812908 |
| 13 | 9757 | 9757.18494039595 | -0.184940395951372 |
| 14 | 9788 | 9788.06167461423 | -0.0616746142293476 |
| 15 | 9813 | 9812.19070582611 | 0.809294173889648 |
| 16 | 9823 | 9823.0779927836 | -0.0779927836005588 |
| 17 | 9837 | 9837.14173995776 | -0.141739957758986 |
| 18 | 9842 | 9842.0473726247 | -0.0473726246966059 |
| 19 | 9855 | 9856.08265547668 | -1.08265547667913 |
| 20 | 9863 | 9862.99954148221 | 0.000458517793079122 |
| 21 | 9855 | 9854.06311220176 | 0.936887798239709 |
| 22 | 9858 | 9857.92821897476 | 0.0717810252385898 |
| 23 | 9853 | 9853.06645515915 | -0.0664551591527445 |
| 24 | 9858 | 9857.93735246774 | 0.0626475322588148 |
| 25 | 9859 | 9858.11710514418 | 0.882894855818415 |
| 26 | 9865 | 9864.96168364513 | 0.0383163548707539 |
| 27 | 9876 | 9876.14681526853 | -0.146815268527113 |
| 28 | 9928 | 9928.0732444772 | -0.0732444772004724 |
| 29 | 9948 | 9948.12249817389 | -0.122498173893168 |
| 30 | 9987 | 9987.0357176091 | -0.0357176090990198 |
| 31 | 10022 | 10021.9900837639 | 0.00991623606168396 |
| 32 | 10068 | 10068.0168071529 | -0.0168071529073484 |
| 33 | 10101 | 10100.9243754202 | 0.075624579822161 |
| 34 | 10131 | 10131.0220023788 | -0.0220023788197455 |
| 35 | 10143 | 10142.8881920233 | 0.111807976749749 |
| 36 | 10170 | 10169.9538341562 | 0.0461658438244485 |
| 37 | 10192 | 10191.8797408293 | 0.120259170698654 |
| 38 | 10214 | 10213.9534933888 | 0.0465066111752354 |
| 39 | 10239 | 10239.886092163 | -0.886092162981523 |
| 40 | 10263 | 10262.9846675375 | 0.0153324625496398 |
| 41 | 10310 | 10309.9660812297 | 0.0339187702885007 |
| 42 | 10355 | 10355.0490602853 | -0.0490602852604938 |
| 43 | 10396 | 10396.0037810263 | -0.00378102629732041 |
| 44 | 10446 | 10446.0570452369 | -0.0570452368540121 |
| 45 | 10511 | 10510.9623284072 | 0.0376715928095495 |
| 46 | 10585 | 10585.0375086117 | -0.0375086117309632 |
| 47 | 10667 | 10666.9142912989 | 0.0857087011022173 |
| 48 | 10753 | 10752.9334951762 | 0.0665048237866482 |
| 49 | 10840 | 10839.9052295724 | 0.094770427614709 |
| 50 | 10951 | 10950.9499077589 | 0.0500922411052053 |
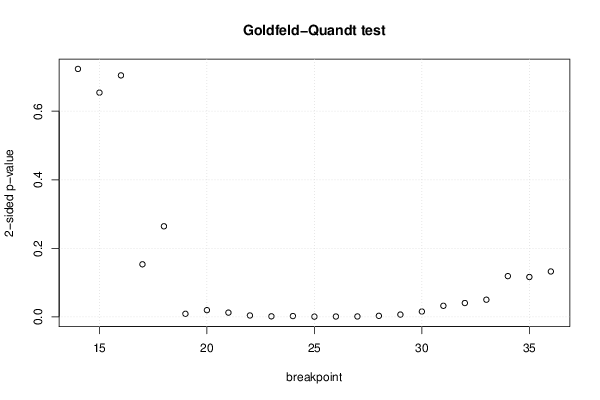
| Goldfeld-Quandt test for Heteroskedasticity | |||
| p-values | Alternative Hypothesis | ||
| breakpoint index | greater | 2-sided | less |
| 14 | 0.638326293749741 | 0.723347412500518 | 0.361673706250259 |
| 15 | 0.672875385896544 | 0.654249228206912 | 0.327124614103456 |
| 16 | 0.647724806165785 | 0.70455038766843 | 0.352275193834215 |
| 17 | 0.923347444423611 | 0.153305111152778 | 0.0766525555763891 |
| 18 | 0.867868754017324 | 0.264262491965353 | 0.132131245982676 |
| 19 | 0.995559951724526 | 0.00888009655094866 | 0.00444004827547433 |
| 20 | 0.990212531219442 | 0.0195749375611169 | 0.00978746878055846 |
| 21 | 0.993849102712421 | 0.0123017945751572 | 0.00615089728757861 |
| 22 | 0.997979612950062 | 0.00404077409987583 | 0.00202038704993791 |
| 23 | 0.99923697038505 | 0.00152605922989905 | 0.000763029614949525 |
| 24 | 0.998840466703245 | 0.00231906659351095 | 0.00115953329675547 |
| 25 | 0.999722348288623 | 0.000555303422754038 | 0.000277651711377019 |
| 26 | 0.999526464254351 | 0.000947071491297674 | 0.000473535745648837 |
| 27 | 0.999435136600272 | 0.00112972679945611 | 0.000564863399728056 |
| 28 | 0.998516701874355 | 0.00296659625128994 | 0.00148329812564497 |
| 29 | 0.996720842482478 | 0.00655831503504383 | 0.00327915751752191 |
| 30 | 0.992231741669248 | 0.015536516661503 | 0.00776825833075152 |
| 31 | 0.983880238854646 | 0.0322395222907088 | 0.0161197611453544 |
| 32 | 0.979833311705985 | 0.0403333765880308 | 0.0201666882940154 |
| 33 | 0.974988906331984 | 0.050022187336032 | 0.025011093668016 |
| 34 | 0.940574281616596 | 0.118851436766808 | 0.0594257183834042 |
| 35 | 0.941885824200504 | 0.116228351598993 | 0.0581141757994963 |
| 36 | 0.933819883358553 | 0.132360233282894 | 0.0661801166414472 |
| Meta Analysis of Goldfeld-Quandt test for Heteroskedasticity | |||
| Description | # significant tests | % significant tests | OK/NOK |
| 1% type I error level | 9 | 0.391304347826087 | NOK |
| 5% type I error level | 14 | 0.608695652173913 | NOK |
| 10% type I error level | 15 | 0.652173913043478 | NOK |