| Multiple Linear Regression - Estimated Regression Equation |
| totaal[t] = + 4259.99549337886 -3221141.49097529jaar[t] + 1.06468303413298pop[t] + 0.997923725333532totaal_vlaams_gewest[t] + 0.00160827991792537pop_vlaams_gewest[t] + 0.996295350589865totaal_waals_gewest[t] -0.00393208881846759waals_gewest_pop[t] + 1.00701452876714totaal_brussel[t] + 0.00259976958969175totaal_brussel_pop[t] -2.03578271407261t + e[t] |
| Multiple Linear Regression - Ordinary Least Squares | |||||
| Variable | Parameter | S.D. | T-STAT H0: parameter = 0 | 2-tail p-value | 1-tail p-value |
| (Intercept) | 4259.99549337886 | 13868.598889 | 0.3072 | 0.760309 | 0.380154 |
| jaar | -3221141.49097529 | 10515103.741065 | -0.3063 | 0.760939 | 0.380469 |
| pop | 1.06468303413298 | 9.505626 | 0.112 | 0.911379 | 0.45569 |
| totaal_vlaams_gewest | 0.997923725333532 | 0.010658 | 93.6341 | 0 | 0 |
| pop_vlaams_gewest | 0.00160827991792537 | 0.002987 | 0.5384 | 0.593275 | 0.296637 |
| totaal_waals_gewest | 0.996295350589865 | 0.012851 | 77.5272 | 0 | 0 |
| waals_gewest_pop | -0.00393208881846759 | 0.008387 | -0.4688 | 0.641731 | 0.320865 |
| totaal_brussel | 1.00701452876714 | 0.010351 | 97.2896 | 0 | 0 |
| totaal_brussel_pop | 0.00259976958969175 | 0.005529 | 0.4702 | 0.640757 | 0.320379 |
| t | -2.03578271407261 | 6.741868 | -0.302 | 0.764246 | 0.382123 |
| Multiple Linear Regression - Regression Statistics | |
| Multiple R | 0.999998861394583 |
| R-squared | 0.999997722790462 |
| Adjusted R-squared | 0.999997210418316 |
| F-TEST (value) | 1951701.96220418 |
| F-TEST (DF numerator) | 9 |
| F-TEST (DF denominator) | 40 |
| p-value | 0 |
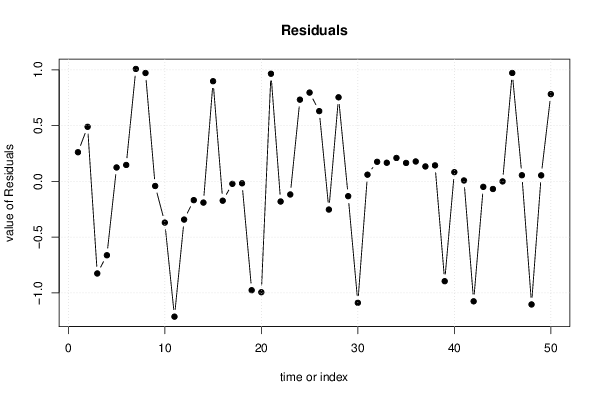
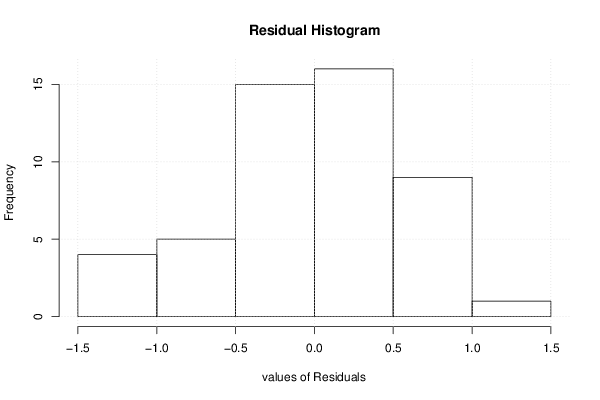
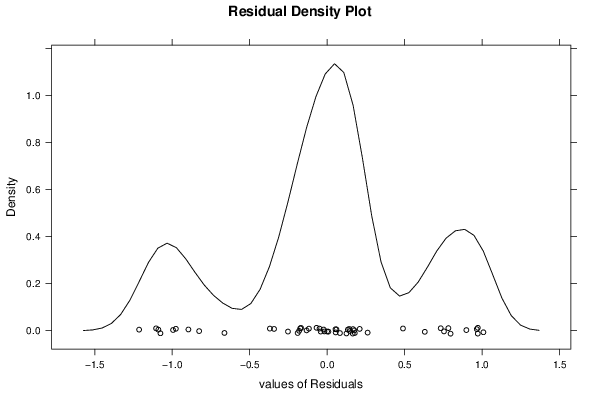
| Multiple Linear Regression - Residual Statistics | |
| Residual Standard Deviation | 0.658700569201215 |
| Sum Squared Residuals | 17.3554575946402 |
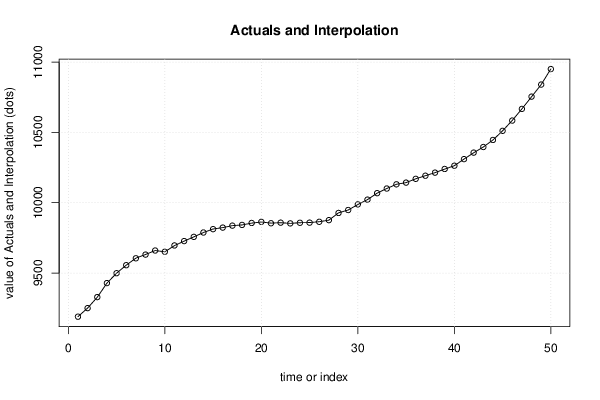
| Multiple Linear Regression - Actuals, Interpolation, and Residuals | |||
| Time or Index | Actuals | Interpolation Forecast | Residuals Prediction Error |
| 1 | 9190 | 9189.73864978858 | 0.261350211418619 |
| 2 | 9251 | 9250.51046849499 | 0.48953150500778 |
| 3 | 9328 | 9328.82640512686 | -0.826405126859349 |
| 4 | 9428 | 9428.66295146443 | -0.662951464427828 |
| 5 | 9499 | 9498.875320077 | 0.124679922994852 |
| 6 | 9556 | 9555.85290220253 | 0.147097797470653 |
| 7 | 9606 | 9604.99136104948 | 1.00863895051531 |
| 8 | 9632 | 9631.02772074066 | 0.972279259342775 |
| 9 | 9660 | 9660.04158984239 | -0.0415898423949719 |
| 10 | 9651 | 9651.36985849842 | -0.369858498422573 |
| 11 | 9695 | 9696.21386530547 | -1.21386530547438 |
| 12 | 9727 | 9727.34283362528 | -0.342833625279606 |
| 13 | 9757 | 9757.16854792457 | -0.168547924568667 |
| 14 | 9788 | 9788.19047706362 | -0.190477063620376 |
| 15 | 9813 | 9812.1013765448 | 0.898623455197849 |
| 16 | 9823 | 9823.17358485239 | -0.173584852386299 |
| 17 | 9837 | 9837.02231861561 | -0.0223186156065668 |
| 18 | 9842 | 9842.01731381008 | -0.0173138100838456 |
| 19 | 9855 | 9855.97668345753 | -0.976683457533613 |
| 20 | 9863 | 9863.99487212831 | -0.994872128314935 |
| 21 | 9855 | 9854.03431231729 | 0.965687682708417 |
| 22 | 9858 | 9858.18082692109 | -0.180826921090055 |
| 23 | 9853 | 9853.11766509031 | -0.117665090313815 |
| 24 | 9858 | 9857.26695319759 | 0.733046802408137 |
| 25 | 9859 | 9858.20335928852 | 0.796640711481815 |
| 26 | 9865 | 9864.36971651108 | 0.630283488921963 |
| 27 | 9876 | 9876.25287110742 | -0.252871107418838 |
| 28 | 9928 | 9927.24578943705 | 0.754210562950916 |
| 29 | 9948 | 9948.13292716371 | -0.132927163713349 |
| 30 | 9987 | 9988.08967542191 | -1.08967542191076 |
| 31 | 10022 | 10021.93999168 | 0.0600083200406552 |
| 32 | 10068 | 10067.8243701169 | 0.175629883083909 |
| 33 | 10101 | 10100.8331241382 | 0.166875861801659 |
| 34 | 10131 | 10130.7900309915 | 0.20996900852421 |
| 35 | 10143 | 10142.8346994033 | 0.165300596657694 |
| 36 | 10170 | 10169.8214738921 | 0.178526107853296 |
| 37 | 10192 | 10191.8662731781 | 0.133726821901641 |
| 38 | 10214 | 10213.8567731485 | 0.143226851459803 |
| 39 | 10239 | 10239.8957700578 | -0.895770057766641 |
| 40 | 10263 | 10262.9174601054 | 0.0825398946474249 |
| 41 | 10310 | 10309.9920128589 | 0.00798714107484745 |
| 42 | 10355 | 10356.0762788804 | -1.07627888040358 |
| 43 | 10396 | 10396.0493037488 | -0.0493037488448024 |
| 44 | 10446 | 10446.0684604789 | -0.0684604789478801 |
| 45 | 10511 | 10511.0003766129 | -0.000376612915013426 |
| 46 | 10585 | 10584.0274537405 | 0.972546259508263 |
| 47 | 10667 | 10666.9450348639 | 0.0549651360589481 |
| 48 | 10753 | 10754.1043764276 | -1.10437642760191 |
| 49 | 10840 | 10839.9461607584 | 0.0538392415576985 |
| 50 | 10951 | 10950.2173778487 | 0.78262215131052 |
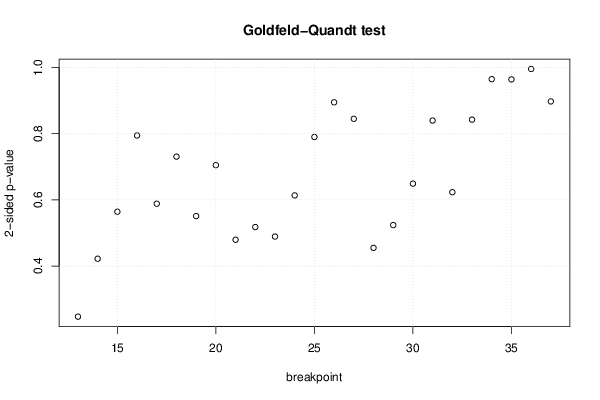
| Goldfeld-Quandt test for Heteroskedasticity | |||
| p-values | Alternative Hypothesis | ||
| breakpoint index | greater | 2-sided | less |
| 13 | 0.87634763757839 | 0.247304724843221 | 0.12365236242161 |
| 14 | 0.788868687997396 | 0.422262624005208 | 0.211131312002604 |
| 15 | 0.717912180181505 | 0.56417563963699 | 0.282087819818495 |
| 16 | 0.602853679992312 | 0.794292640015376 | 0.397146320007688 |
| 17 | 0.705871778094041 | 0.588256443811918 | 0.294128221905959 |
| 18 | 0.634770445588657 | 0.730459108822685 | 0.365229554411343 |
| 19 | 0.724512490780762 | 0.550975018438477 | 0.275487509219238 |
| 20 | 0.647627382334186 | 0.704745235331628 | 0.352372617665814 |
| 21 | 0.760244856804994 | 0.479510286390012 | 0.239755143195006 |
| 22 | 0.741063478976435 | 0.51787304204713 | 0.258936521023565 |
| 23 | 0.755409076633426 | 0.489181846733148 | 0.244590923366574 |
| 24 | 0.693308062163144 | 0.613383875673713 | 0.306691937836856 |
| 25 | 0.605094916279462 | 0.789810167441075 | 0.394905083720538 |
| 26 | 0.552751368800345 | 0.89449726239931 | 0.447248631199655 |
| 27 | 0.577674672545848 | 0.844650654908304 | 0.422325327454152 |
| 28 | 0.772464302972436 | 0.455071394055128 | 0.227535697027564 |
| 29 | 0.73809047373976 | 0.523819052520481 | 0.26190952626024 |
| 30 | 0.675513202525715 | 0.64897359494857 | 0.324486797474285 |
| 31 | 0.580287034368018 | 0.839425931263964 | 0.419712965631982 |
| 32 | 0.68845171517984 | 0.623096569640321 | 0.31154828482016 |
| 33 | 0.57893054035363 | 0.84213891929274 | 0.42106945964637 |
| 34 | 0.482198165621253 | 0.964396331242506 | 0.517801834378747 |
| 35 | 0.518156439042352 | 0.963687121915295 | 0.481843560957648 |
| 36 | 0.502394707512004 | 0.995210584975992 | 0.497605292487996 |
| 37 | 0.551400842346099 | 0.897198315307802 | 0.448599157653901 |
| Meta Analysis of Goldfeld-Quandt test for Heteroskedasticity | |||
| Description | # significant tests | % significant tests | OK/NOK |
| 1% type I error level | 0 | 0 | OK |
| 5% type I error level | 0 | 0 | OK |
| 10% type I error level | 0 | 0 | OK |