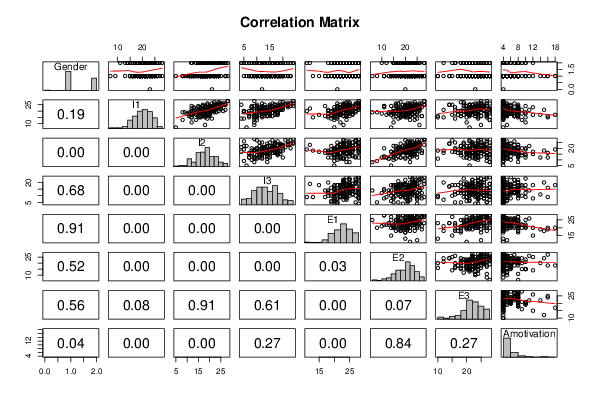
| Correlations for all pairs of data series (method=pearson) | ||||||||
| Gender | I1 | I2 | I3 | E1 | E2 | E3 | Amotivation | |
| Gender | 1 | 0.103 | 0.245 | -0.033 | -0.009 | 0.051 | -0.046 | -0.163 |
| I1 | 0.103 | 1 | 0.599 | 0.521 | 0.457 | 0.239 | 0.136 | -0.298 |
| I2 | 0.245 | 0.599 | 1 | 0.445 | 0.26 | 0.562 | -0.009 | -0.24 |
| I3 | -0.033 | 0.521 | 0.445 | 1 | 0.241 | 0.25 | 0.04 | 0.088 |
| E1 | -0.009 | 0.457 | 0.26 | 0.241 | 1 | 0.168 | 0.416 | -0.293 |
| E2 | 0.051 | 0.239 | 0.562 | 0.25 | 0.168 | 1 | 0.144 | -0.016 |
| E3 | -0.046 | 0.136 | -0.009 | 0.04 | 0.416 | 0.144 | 1 | -0.087 |
| Amotivation | -0.163 | -0.298 | -0.24 | 0.088 | -0.293 | -0.016 | -0.087 | 1 |
| Correlations for all pairs of data series with p-values | |||
| pair | Pearson r | Spearman rho | Kendall tau |
| Gender;I1 | 0.1025 | 0.1202 | 0.1013 |
| p-value | (0.1941) | (0.1277) | (0.1288) |
| Gender;I2 | 0.2454 | 0.2388 | 0.2002 |
| p-value | (0.0016) | (0.0022) | (0.0025) |
| Gender;I3 | -0.0331 | -0.0348 | -0.0289 |
| p-value | (0.6762) | (0.6603) | (0.6621) |
| Gender;E1 | -0.009 | -0.0188 | -0.016 |
| p-value | (0.9096) | (0.8123) | (0.8124) |
| Gender;E2 | 0.051 | 0.0377 | 0.0315 |
| p-value | (0.5194) | (0.6338) | (0.6359) |
| Gender;E3 | -0.046 | -0.0644 | -0.0547 |
| p-value | (0.5607) | (0.4155) | (0.4136) |
| Gender;Amotivation | -0.1625 | -0.1696 | -0.1531 |
| p-value | (0.0388) | (0.0309) | (0.0312) |
| I1;I2 | 0.5992 | 0.5852 | 0.4418 |
| p-value | (0) | (0) | (0) |
| I1;I3 | 0.5207 | 0.5018 | 0.3854 |
| p-value | (0) | (0) | (0) |
| I1;E1 | 0.4571 | 0.5076 | 0.3779 |
| p-value | (0) | (0) | (0) |
| I1;E2 | 0.2385 | 0.2688 | 0.2047 |
| p-value | (0.0022) | (5e-04) | (3e-04) |
| I1;E3 | 0.1362 | 0.1478 | 0.1162 |
| p-value | (0.0839) | (0.0606) | (0.0415) |
| I1;Amotivation | -0.298 | -0.3371 | -0.2642 |
| p-value | (1e-04) | (0) | (0) |
| I2;I3 | 0.4452 | 0.44 | 0.3331 |
| p-value | (0) | (0) | (0) |
| I2;E1 | 0.2605 | 0.3057 | 0.2201 |
| p-value | (8e-04) | (1e-04) | (1e-04) |
| I2;E2 | 0.5616 | 0.5005 | 0.3812 |
| p-value | (0) | (0) | (0) |
| I2;E3 | -0.0094 | 0.0291 | 0.0222 |
| p-value | (0.9058) | (0.7132) | (0.6956) |
| I2;Amotivation | -0.2399 | -0.2839 | -0.22 |
| p-value | (0.0021) | (3e-04) | (3e-04) |
| I3;E1 | 0.2411 | 0.2578 | 0.1921 |
| p-value | (0.002) | (9e-04) | (7e-04) |
| I3;E2 | 0.2504 | 0.2241 | 0.1653 |
| p-value | (0.0013) | (0.0041) | (0.0033) |
| I3;E3 | 0.0402 | -0.0096 | -0.0092 |
| p-value | (0.6116) | (0.9035) | (0.8702) |
| I3;Amotivation | 0.0877 | 0.09 | 0.0713 |
| p-value | (0.2673) | (0.2545) | (0.235) |
| E1;E2 | 0.1678 | 0.2423 | 0.1748 |
| p-value | (0.0329) | (0.0019) | (0.0022) |
| E1;E3 | 0.416 | 0.4224 | 0.3239 |
| p-value | (0) | (0) | (0) |
| E1;Amotivation | -0.2927 | -0.2716 | -0.2172 |
| p-value | (2e-04) | (5e-04) | (4e-04) |
| E2;E3 | 0.1444 | 0.254 | 0.1824 |
| p-value | (0.0667) | (0.0011) | (0.0013) |
| E2;Amotivation | -0.0155 | -0.0199 | -0.0174 |
| p-value | (0.8445) | (0.8015) | (0.7734) |
| E3;Amotivation | -0.0871 | -0.0209 | -0.0175 |
| p-value | (0.2707) | (0.7918) | (0.7731) |