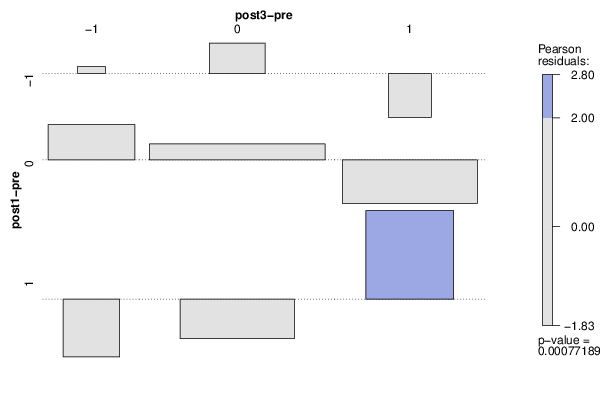
| Tabulation of Results | |||
| post1-pre x post3-pre | |||
| -1 | 0 | 1 | -1 | 1 | 5 | 0 | 0 | 11 | 35 | 13 | 1 | 0 | 9 | 16 |
| Tabulation of Expected Results | |||
| post1-pre x post3-pre | |||
| -1 | 0 | 1 | -1 | 0.8 | 3.27 | 1.93 | 0 | 7.87 | 32.12 | 19.01 | 1 | 3.33 | 13.61 | 8.06 |
| Statistical Results | |
| Pearson's Chi-squared test with simulated p-value (based on 2000 replicates) | |
| Exact Pearson Chi Square Statistic | 19.04 |
| P value | 0 |