Free Statistics

of Irreproducible Research!

Author's title

Author*The author of this computation has been verified*
R Software Modulerwasp_spectrum.wasp
Title produced by softwareSpectral Analysis
Date of computationWed, 05 Dec 2012 03:47:35 -0500
Cite this page as followsStatistical Computations at FreeStatistics.org, Office for Research Development and Education, URL https://freestatistics.org/blog/index.php?v=date/2012/Dec/05/t1354697261vaaqtmm8nzzth7p.htm/, Retrieved Thu, 25 Apr 2024 20:14:06 +0000
Statistical Computations at FreeStatistics.org, Office for Research Development and Education, URL https://freestatistics.org/blog/index.php?pk=196723, Retrieved Thu, 25 Apr 2024 20:14:06 +0000
QR Codes:

Original text written by user:
IsPrivate?No (this computation is public)
User-defined keywords
Estimated Impact122
Family? (F = Feedback message, R = changed R code, M = changed R Module, P = changed Parameters, D = changed Data)
-     [Univariate Data Series] [] [2008-12-08 19:22:39] [d2d412c7f4d35ffbf5ee5ee89db327d4]
- RMPD  [Central Tendency] [] [2011-12-06 20:01:16] [b98453cac15ba1066b407e146608df68]
- RMP       [Spectral Analysis] [] [2012-12-05 08:47:35] [c52127b355a401c4b5ab4a80e41e35a5] [Current]
Feedback Forum

Post a new message
Dataseries X:
867.887509505211
-2250.28069676838
33618.3570412959
9954.34468238836
354.191730842355
18882.406400463
20229.4310915672
268402.416151187
-113346.926055862
-45016.394227939
35069.861367254
58531.0957290091
-77256.3771198791
-31473.594568955
-52391.0075132882
32854.9847569661
101107.732845397
-176275.960398033
79531.884415102
-176414.251561376
151290.579462589
167731.594163443
143237.122434691
80251.9665265577
118735.726273623
75035.8259037494
19198.3085437346
-36364.5639276314
-36170.5787440905
-109567.395064155
-100783.336097857
-149267.403931369
38947.3510583149
58613.0600994635
16074.4602044407
-41563.0049150659
-15970.5964777959
-47563.9548420802
59595.3577179922
65897.8405390448
-166489.283203891
46312.3269884632
-15952.8722863516
-87780.6523566012
134744.172737777
75232.8122408289
24408.7558471514
-15406.1403381955
-3766.75348767364
27197.2239951006
-46777.2890031503
-82472.8212609495
-35154.7184801844
-46946.870011609
-43641.5364941684
-54920.7084991732
54905.4038222157
-10509.5840707596
-13706.8046976985
-42347.6087628011
-28990.4687708701


Summary of computational transaction
Raw Inputview raw input (R code)
Raw Outputview raw output of R engine
Computing time2 seconds
R Server'Gwilym Jenkins' @ jenkins.wessa.net

\begin{tabular}{lllllllll}
\hline
Summary of computational transaction \tabularnewline
Raw Input & view raw input (R code)  \tabularnewline
Raw Output & view raw output of R engine  \tabularnewline
Computing time & 2 seconds \tabularnewline
R Server & 'Gwilym Jenkins' @ jenkins.wessa.net \tabularnewline
\hline
\end{tabular}
%Source: https://freestatistics.org/blog/index.php?pk=196723&T=0

[TABLE]
[ROW][C]Summary of computational transaction[/C][/ROW]
[ROW][C]Raw Input[/C][C]view raw input (R code) [/C][/ROW]
[ROW][C]Raw Output[/C][C]view raw output of R engine [/C][/ROW]
[ROW][C]Computing time[/C][C]2 seconds[/C][/ROW]
[ROW][C]R Server[/C][C]'Gwilym Jenkins' @ jenkins.wessa.net[/C][/ROW]
[/TABLE]
Source: https://freestatistics.org/blog/index.php?pk=196723&T=0

Globally Unique Identifier (entire table): ba.freestatistics.org/blog/index.php?pk=196723&T=0

As an alternative you can also use a QR Code:  

The GUIDs for individual cells are displayed in the table below:

Summary of computational transaction
Raw Inputview raw input (R code)
Raw Outputview raw output of R engine
Computing time2 seconds
R Server'Gwilym Jenkins' @ jenkins.wessa.net


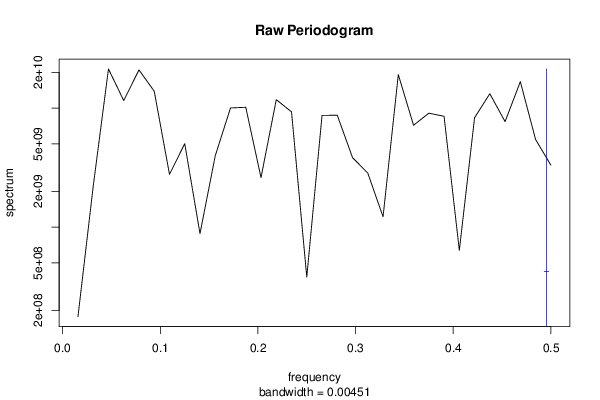
Raw Periodogram
ParameterValue
Box-Cox transformation parameter (lambda)1
Degree of non-seasonal differencing (d)0
Degree of seasonal differencing (D)0
Seasonal Period (s)12
Frequency (Period)Spectrum
0.0156 (64)176759835.789853
0.0312 (32)2203731652.11974
0.0469 (21.3333)21336150662.3967
0.0625 (16)11563683191.3414
0.0781 (12.8)20939069833.6067
0.0938 (10.6667)13867558173.1161
0.1094 (9.1429)2776709920.97921
0.125 (8)5025725392.98227
0.1406 (7.1111)881396403.302046
0.1562 (6.4)3976026295.33349
0.1719 (5.8182)10030800076.1888
0.1875 (5.3333)10163503570.1046
0.2031 (4.9231)2604927305.86014
0.2188 (4.5714)11766418823.7196
0.2344 (4.2667)9303204021.15178
0.25 (4)380060717.6773
0.2656 (3.7647)8690279245.28907
0.2812 (3.5556)8703765293.18056
0.2969 (3.3684)3835908900.5826
0.3125 (3.2)2843544140.74292
0.3281 (3.0476)1221079911.51599
0.3438 (2.9091)19123543724.0479
0.3594 (2.7826)7172403833.01239
0.375 (2.6667)9066492373.72271
0.3906 (2.56)8535930084.5514
0.4062 (2.4615)637207877.547279
0.4219 (2.3704)8306816254.29303
0.4375 (2.2857)13204688619.9693
0.4531 (2.2069)7695619690.3189
0.4688 (2.1333)16690784582.9314
0.4844 (2.0645)5443205358.02404
0.5 (2)3319996460.08337

\begin{tabular}{lllllllll}
\hline
Raw Periodogram \tabularnewline
Parameter & Value \tabularnewline
Box-Cox transformation parameter (lambda) & 1 \tabularnewline
Degree of non-seasonal differencing (d) & 0 \tabularnewline
Degree of seasonal differencing (D) & 0 \tabularnewline
Seasonal Period (s) & 12 \tabularnewline
Frequency (Period) & Spectrum \tabularnewline
0.0156 (64) & 176759835.789853 \tabularnewline
0.0312 (32) & 2203731652.11974 \tabularnewline
0.0469 (21.3333) & 21336150662.3967 \tabularnewline
0.0625 (16) & 11563683191.3414 \tabularnewline
0.0781 (12.8) & 20939069833.6067 \tabularnewline
0.0938 (10.6667) & 13867558173.1161 \tabularnewline
0.1094 (9.1429) & 2776709920.97921 \tabularnewline
0.125 (8) & 5025725392.98227 \tabularnewline
0.1406 (7.1111) & 881396403.302046 \tabularnewline
0.1562 (6.4) & 3976026295.33349 \tabularnewline
0.1719 (5.8182) & 10030800076.1888 \tabularnewline
0.1875 (5.3333) & 10163503570.1046 \tabularnewline
0.2031 (4.9231) & 2604927305.86014 \tabularnewline
0.2188 (4.5714) & 11766418823.7196 \tabularnewline
0.2344 (4.2667) & 9303204021.15178 \tabularnewline
0.25 (4) & 380060717.6773 \tabularnewline
0.2656 (3.7647) & 8690279245.28907 \tabularnewline
0.2812 (3.5556) & 8703765293.18056 \tabularnewline
0.2969 (3.3684) & 3835908900.5826 \tabularnewline
0.3125 (3.2) & 2843544140.74292 \tabularnewline
0.3281 (3.0476) & 1221079911.51599 \tabularnewline
0.3438 (2.9091) & 19123543724.0479 \tabularnewline
0.3594 (2.7826) & 7172403833.01239 \tabularnewline
0.375 (2.6667) & 9066492373.72271 \tabularnewline
0.3906 (2.56) & 8535930084.5514 \tabularnewline
0.4062 (2.4615) & 637207877.547279 \tabularnewline
0.4219 (2.3704) & 8306816254.29303 \tabularnewline
0.4375 (2.2857) & 13204688619.9693 \tabularnewline
0.4531 (2.2069) & 7695619690.3189 \tabularnewline
0.4688 (2.1333) & 16690784582.9314 \tabularnewline
0.4844 (2.0645) & 5443205358.02404 \tabularnewline
0.5 (2) & 3319996460.08337 \tabularnewline
\hline
\end{tabular}
%Source: https://freestatistics.org/blog/index.php?pk=196723&T=1

[TABLE]
[ROW][C]Raw Periodogram[/C][/ROW]
[ROW][C]Parameter[/C][C]Value[/C][/ROW]
[ROW][C]Box-Cox transformation parameter (lambda)[/C][C]1[/C][/ROW]
[ROW][C]Degree of non-seasonal differencing (d)[/C][C]0[/C][/ROW]
[ROW][C]Degree of seasonal differencing (D)[/C][C]0[/C][/ROW]
[ROW][C]Seasonal Period (s)[/C][C]12[/C][/ROW]
[ROW][C]Frequency (Period)[/C][C]Spectrum[/C][/ROW]
[ROW][C]0.0156 (64)[/C][C]176759835.789853[/C][/ROW]
[ROW][C]0.0312 (32)[/C][C]2203731652.11974[/C][/ROW]
[ROW][C]0.0469 (21.3333)[/C][C]21336150662.3967[/C][/ROW]
[ROW][C]0.0625 (16)[/C][C]11563683191.3414[/C][/ROW]
[ROW][C]0.0781 (12.8)[/C][C]20939069833.6067[/C][/ROW]
[ROW][C]0.0938 (10.6667)[/C][C]13867558173.1161[/C][/ROW]
[ROW][C]0.1094 (9.1429)[/C][C]2776709920.97921[/C][/ROW]
[ROW][C]0.125 (8)[/C][C]5025725392.98227[/C][/ROW]
[ROW][C]0.1406 (7.1111)[/C][C]881396403.302046[/C][/ROW]
[ROW][C]0.1562 (6.4)[/C][C]3976026295.33349[/C][/ROW]
[ROW][C]0.1719 (5.8182)[/C][C]10030800076.1888[/C][/ROW]
[ROW][C]0.1875 (5.3333)[/C][C]10163503570.1046[/C][/ROW]
[ROW][C]0.2031 (4.9231)[/C][C]2604927305.86014[/C][/ROW]
[ROW][C]0.2188 (4.5714)[/C][C]11766418823.7196[/C][/ROW]
[ROW][C]0.2344 (4.2667)[/C][C]9303204021.15178[/C][/ROW]
[ROW][C]0.25 (4)[/C][C]380060717.6773[/C][/ROW]
[ROW][C]0.2656 (3.7647)[/C][C]8690279245.28907[/C][/ROW]
[ROW][C]0.2812 (3.5556)[/C][C]8703765293.18056[/C][/ROW]
[ROW][C]0.2969 (3.3684)[/C][C]3835908900.5826[/C][/ROW]
[ROW][C]0.3125 (3.2)[/C][C]2843544140.74292[/C][/ROW]
[ROW][C]0.3281 (3.0476)[/C][C]1221079911.51599[/C][/ROW]
[ROW][C]0.3438 (2.9091)[/C][C]19123543724.0479[/C][/ROW]
[ROW][C]0.3594 (2.7826)[/C][C]7172403833.01239[/C][/ROW]
[ROW][C]0.375 (2.6667)[/C][C]9066492373.72271[/C][/ROW]
[ROW][C]0.3906 (2.56)[/C][C]8535930084.5514[/C][/ROW]
[ROW][C]0.4062 (2.4615)[/C][C]637207877.547279[/C][/ROW]
[ROW][C]0.4219 (2.3704)[/C][C]8306816254.29303[/C][/ROW]
[ROW][C]0.4375 (2.2857)[/C][C]13204688619.9693[/C][/ROW]
[ROW][C]0.4531 (2.2069)[/C][C]7695619690.3189[/C][/ROW]
[ROW][C]0.4688 (2.1333)[/C][C]16690784582.9314[/C][/ROW]
[ROW][C]0.4844 (2.0645)[/C][C]5443205358.02404[/C][/ROW]
[ROW][C]0.5 (2)[/C][C]3319996460.08337[/C][/ROW]
[/TABLE]
Source: https://freestatistics.org/blog/index.php?pk=196723&T=1

Globally Unique Identifier (entire table): ba.freestatistics.org/blog/index.php?pk=196723&T=1

As an alternative you can also use a QR Code:  

The GUIDs for individual cells are displayed in the table below:

Raw Periodogram
ParameterValue
Box-Cox transformation parameter (lambda)1
Degree of non-seasonal differencing (d)0
Degree of seasonal differencing (D)0
Seasonal Period (s)12
Frequency (Period)Spectrum
0.0156 (64)176759835.789853
0.0312 (32)2203731652.11974
0.0469 (21.3333)21336150662.3967
0.0625 (16)11563683191.3414
0.0781 (12.8)20939069833.6067
0.0938 (10.6667)13867558173.1161
0.1094 (9.1429)2776709920.97921
0.125 (8)5025725392.98227
0.1406 (7.1111)881396403.302046
0.1562 (6.4)3976026295.33349
0.1719 (5.8182)10030800076.1888
0.1875 (5.3333)10163503570.1046
0.2031 (4.9231)2604927305.86014
0.2188 (4.5714)11766418823.7196
0.2344 (4.2667)9303204021.15178
0.25 (4)380060717.6773
0.2656 (3.7647)8690279245.28907
0.2812 (3.5556)8703765293.18056
0.2969 (3.3684)3835908900.5826
0.3125 (3.2)2843544140.74292
0.3281 (3.0476)1221079911.51599
0.3438 (2.9091)19123543724.0479
0.3594 (2.7826)7172403833.01239
0.375 (2.6667)9066492373.72271
0.3906 (2.56)8535930084.5514
0.4062 (2.4615)637207877.547279
0.4219 (2.3704)8306816254.29303
0.4375 (2.2857)13204688619.9693
0.4531 (2.2069)7695619690.3189
0.4688 (2.1333)16690784582.9314
0.4844 (2.0645)5443205358.02404
0.5 (2)3319996460.08337


Parameters (Session):
par1 = 1 ; par2 = 0 ; par3 = 0 ; par4 = 12 ;
Parameters (R input):
par1 = 1 ; par2 = 0 ; par3 = 0 ; par4 = 12 ;
R code (references can be found in the software module):
par4 <- '12'
par3 <- '1'
par2 <- '0'
par1 <- '1'
par1 <- as.numeric(par1)
par2 <- as.numeric(par2)
par3 <- as.numeric(par3)
par4 <- as.numeric(par4)
if (par1 == 0) {
x <- log(x)
} else {
x <- (x ^ par1 - 1) / par1
}
if (par2 > 0) x <- diff(x,lag=1,difference=par2)
if (par3 > 0) x <- diff(x,lag=par4,difference=par3)
bitmap(file='test1.png')
r <- spectrum(x,main='Raw Periodogram')
dev.off()
bitmap(file='test2.png')
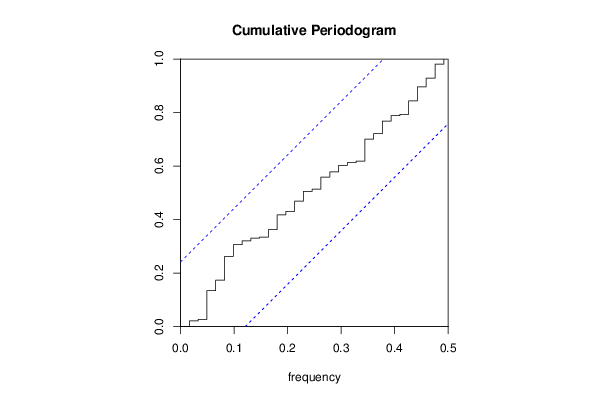
cpgram(x,main='Cumulative Periodogram')
dev.off()
load(file='createtable')
a<-table.start()
a<-table.row.start(a)
a<-table.element(a,'Raw Periodogram',2,TRUE)
a<-table.row.end(a)
a<-table.row.start(a)
a<-table.element(a,'Parameter',header=TRUE)
a<-table.element(a,'Value',header=TRUE)
a<-table.row.end(a)
a<-table.row.start(a)
a<-table.element(a,'Box-Cox transformation parameter (lambda)',header=TRUE)
a<-table.element(a,par1)
a<-table.row.end(a)
a<-table.row.start(a)
a<-table.element(a,'Degree of non-seasonal differencing (d)',header=TRUE)
a<-table.element(a,par2)
a<-table.row.end(a)
a<-table.row.start(a)
a<-table.element(a,'Degree of seasonal differencing (D)',header=TRUE)
a<-table.element(a,par3)
a<-table.row.end(a)
a<-table.row.start(a)
a<-table.element(a,'Seasonal Period (s)',header=TRUE)
a<-table.element(a,par4)
a<-table.row.end(a)
a<-table.row.start(a)
a<-table.element(a,'Frequency (Period)',header=TRUE)
a<-table.element(a,'Spectrum',header=TRUE)
a<-table.row.end(a)
for (i in 1:length(r$freq)) {
a<-table.row.start(a)
mylab <- round(r$freq[i],4)
mylab <- paste(mylab,' (',sep='')
mylab <- paste(mylab,round(1/r$freq[i],4),sep='')
mylab <- paste(mylab,')',sep='')
a<-table.element(a,mylab,header=TRUE)
a<-table.element(a,round(r$spec[i],6))
a<-table.row.end(a)
}
a<-table.end(a)
table.save(a,file='mytable.tab')