Free Statistics
of Irreproducible Research!
Description of Statistical Computation | |||||||||||||||||||||||||||||||||||||||||
|---|---|---|---|---|---|---|---|---|---|---|---|---|---|---|---|---|---|---|---|---|---|---|---|---|---|---|---|---|---|---|---|---|---|---|---|---|---|---|---|---|---|
| Author's title | |||||||||||||||||||||||||||||||||||||||||
| Author | *The author of this computation has been verified* | ||||||||||||||||||||||||||||||||||||||||
| R Software Module | rwasp_univariatedataseries.wasp | ||||||||||||||||||||||||||||||||||||||||
| Title produced by software | Univariate Data Series | ||||||||||||||||||||||||||||||||||||||||
| Date of computation | Tue, 04 Dec 2012 15:06:30 -0500 | ||||||||||||||||||||||||||||||||||||||||
| Cite this page as follows | Statistical Computations at FreeStatistics.org, Office for Research Development and Education, URL https://freestatistics.org/blog/index.php?v=date/2012/Dec/04/t1354651612u6uwfwax7cfee7r.htm/, Retrieved Wed, 24 Apr 2024 11:43:51 +0000 | ||||||||||||||||||||||||||||||||||||||||
| Statistical Computations at FreeStatistics.org, Office for Research Development and Education, URL https://freestatistics.org/blog/index.php?pk=196578, Retrieved Wed, 24 Apr 2024 11:43:51 +0000 | |||||||||||||||||||||||||||||||||||||||||
| QR Codes: | |||||||||||||||||||||||||||||||||||||||||
|
| |||||||||||||||||||||||||||||||||||||||||
| Original text written by user: | |||||||||||||||||||||||||||||||||||||||||
| IsPrivate? | No (this computation is public) | ||||||||||||||||||||||||||||||||||||||||
| User-defined keywords | |||||||||||||||||||||||||||||||||||||||||
| Estimated Impact | 129 | ||||||||||||||||||||||||||||||||||||||||
Tree of Dependent Computations | |||||||||||||||||||||||||||||||||||||||||
| Family? (F = Feedback message, R = changed R code, M = changed R Module, P = changed Parameters, D = changed Data) | |||||||||||||||||||||||||||||||||||||||||
| - [Univariate Explorative Data Analysis] [Run Sequence gebo...] [2008-12-12 13:32:37] [76963dc1903f0f612b6153510a3818cf] - R D [Univariate Explorative Data Analysis] [Run Sequence gebo...] [2008-12-17 12:14:40] [76963dc1903f0f612b6153510a3818cf] - [Univariate Explorative Data Analysis] [Run Sequence Plot...] [2008-12-22 18:19:51] [1ce0d16c8f4225c977b42c8fa93bc163] - RMP [Univariate Data Series] [Identifying Integ...] [2009-11-22 12:08:06] [b98453cac15ba1066b407e146608df68] - PD [Univariate Data Series] [WS 8, maandelijks...] [2010-11-28 09:47:18] [d946de7cca328fbcf207448a112523ab] - PD [Univariate Data Series] [WS 8, maandelijks...] [2010-11-28 12:21:51] [d946de7cca328fbcf207448a112523ab] - PD [Univariate Data Series] [Workshop 8, maand...] [2010-11-28 19:48:13] [d946de7cca328fbcf207448a112523ab] - R PD [Univariate Data Series] [] [2011-11-25 08:33:33] [46896e8a404bb9354f2d070359621409] - PD [Univariate Data Series] [Maandelijks geboo...] [2012-12-04 20:06:30] [4cf5995ff1ac45697158e3095d381e89] [Current] - PD [Univariate Data Series] [Maandelijks geboo...] [2012-12-04 20:16:13] [dc1c1ef052cd9b8b4f9db3f2b24d140d] | |||||||||||||||||||||||||||||||||||||||||
| Feedback Forum | |||||||||||||||||||||||||||||||||||||||||
Post a new message | |||||||||||||||||||||||||||||||||||||||||
Dataset | |||||||||||||||||||||||||||||||||||||||||
| Dataseries X: | |||||||||||||||||||||||||||||||||||||||||
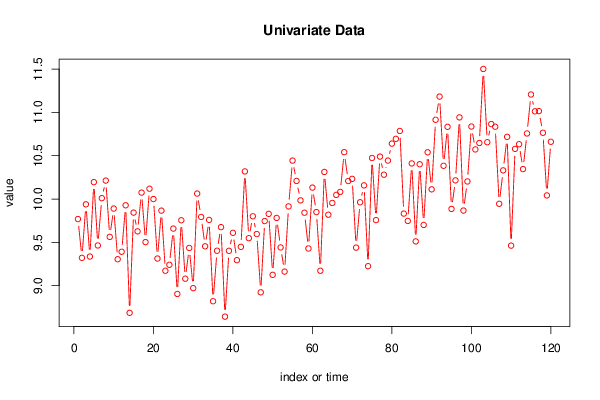
9.769 9.321 9.939 9.336 10.195 9.464 10.010 10.213 9.563 9.890 9.305 9.391 9.928 8.686 9.843 9.627 10.074 9.503 10.119 10.000 9.313 9.866 9.172 9.241 9.659 8.904 9.755 9.080 9.435 8.971 10.063 9.793 9.454 9.759 8.820 9.403 9.676 8.642 9.402 9.610 9.294 9.448 10.319 9.548 9.801 9.596 8.923 9.746 9.829 9.125 9.782 9.441 9.162 9.915 10.444 10.209 9.985 9.842 9.429 10.132 9.849 9.172 10.313 9.819 9.955 10.048 10.082 10.541 10.208 10.233 9.439 9.963 10.158 9.225 10.474 9.757 10.490 10.281 10.444 10.640 10.695 10.786 9.832 9.747 10.411 9.511 10.402 9.701 10.540 10.112 10.915 11.183 10.384 10.834 9.886 10.216 10.943 9.867 10.203 10.837 10.573 10.647 11.502 10.656 10.866 10.835 9.945 10.331 10.718 9.462 10.579 10.633 10.346 10.757 11.207 11.013 11.015 10.765 10.042 10.661 | |||||||||||||||||||||||||||||||||||||||||
Tables (Output of Computation) | |||||||||||||||||||||||||||||||||||||||||
| |||||||||||||||||||||||||||||||||||||||||
Figures (Output of Computation) | |||||||||||||||||||||||||||||||||||||||||
Input Parameters & R Code | |||||||||||||||||||||||||||||||||||||||||
| Parameters (Session): | |||||||||||||||||||||||||||||||||||||||||
| par1 = Maandelijkse geboortecijfer 2000-2009 ; par2 = Bron;http://statbel.fgov.be/nl/modules/publications/statistiques/bevolking/downloads/levendgeborenen_geboortemaand.jsp ; par3 = Maandelijkse geboortecijfer ; par4 = 12 ; | |||||||||||||||||||||||||||||||||||||||||
| Parameters (R input): | |||||||||||||||||||||||||||||||||||||||||
| par1 = Maandelijkse geboortecijfer 2000-2009 ; par2 = Bron;http://statbel.fgov.be/nl/modules/publications/statistiques/bevolking/downloads/levendgeborenen_geboortemaand.jsp ; par3 = Maandelijkse geboortecijfer ; par4 = 12 ; | |||||||||||||||||||||||||||||||||||||||||
| R code (references can be found in the software module): | |||||||||||||||||||||||||||||||||||||||||
bitmap(file='test1.png') | |||||||||||||||||||||||||||||||||||||||||