Free Statistics

of Irreproducible Research!

Author's title

Author*Unverified author*
R Software Module--
Title produced by softwareARIMA Backward Selection
Date of computationTue, 04 Dec 2012 14:33:33 -0500
Cite this page as followsStatistical Computations at FreeStatistics.org, Office for Research Development and Education, URL https://freestatistics.org/blog/index.php?v=date/2012/Dec/04/t1354649631143qdl86f0a7tjj.htm/, Retrieved Wed, 24 Apr 2024 22:33:30 +0000
Statistical Computations at FreeStatistics.org, Office for Research Development and Education, URL https://freestatistics.org/blog/index.php?pk=196549, Retrieved Wed, 24 Apr 2024 22:33:30 +0000
QR Codes:

Original text written by user:
IsPrivate?No (this computation is public)
User-defined keywords
Estimated Impact109
Family? (F = Feedback message, R = changed R code, M = changed R Module, P = changed Parameters, D = changed Data)
-     [ARIMA Backward Selection] [] [2011-12-06 00:39:38] [bdca8f3e7c3554be8c1291e54f61d441]
- RM      [ARIMA Backward Selection] [] [2012-12-04 19:33:33] [d41d8cd98f00b204e9800998ecf8427e] [Current]
Feedback Forum

Post a new message
Dataseries X:
9007
8106
8928
9137
10017
10826
11317
10744
9713
9938
9161
8927
7750
6981
8038
8422
8714
9512
10120
9823
8743
9129
8710
8680
8162
7306
8124
7870
9387
9556
10093
9620
8285
8433
8160
8034
7717
7461
7776
7925
8634
8945
10078
9179
8037
8488
7874
8647
7792
6957
7726
8106
8890
9299
10625
9302
8314
8850
8265
8796
7836
6892
7791
8129
9115
9434
10484
9827
9110
9070
8633
9240


Summary of computational transaction
Raw Inputview raw input (R code)
Raw Outputview raw output of R engine
Computing time15 seconds
R Server'George Udny Yule' @ yule.wessa.net

\begin{tabular}{lllllllll}
\hline
Summary of computational transaction \tabularnewline
Raw Input & view raw input (R code)  \tabularnewline
Raw Output & view raw output of R engine  \tabularnewline
Computing time & 15 seconds \tabularnewline
R Server & 'George Udny Yule' @ yule.wessa.net \tabularnewline
\hline
\end{tabular}
%Source: https://freestatistics.org/blog/index.php?pk=196549&T=0

[TABLE]
[ROW][C]Summary of computational transaction[/C][/ROW]
[ROW][C]Raw Input[/C][C]view raw input (R code) [/C][/ROW]
[ROW][C]Raw Output[/C][C]view raw output of R engine [/C][/ROW]
[ROW][C]Computing time[/C][C]15 seconds[/C][/ROW]
[ROW][C]R Server[/C][C]'George Udny Yule' @ yule.wessa.net[/C][/ROW]
[/TABLE]
Source: https://freestatistics.org/blog/index.php?pk=196549&T=0

Globally Unique Identifier (entire table): ba.freestatistics.org/blog/index.php?pk=196549&T=0

As an alternative you can also use a QR Code:  

The GUIDs for individual cells are displayed in the table below:

Summary of computational transaction
Raw Inputview raw input (R code)
Raw Outputview raw output of R engine
Computing time15 seconds
R Server'George Udny Yule' @ yule.wessa.net


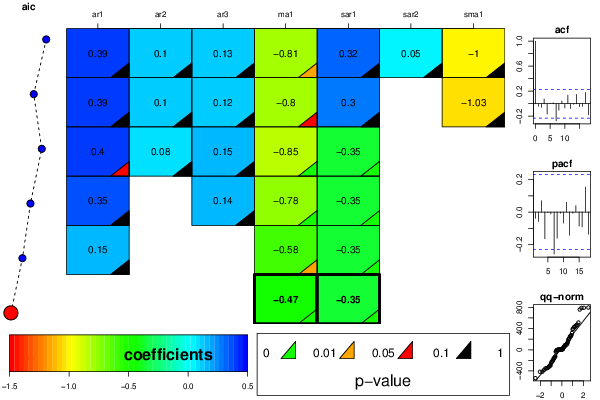
ARIMA Parameter Estimation and Backward Selection
Iterationar1ar2ar3ma1sar1sar2sma1
Estimates ( 1 )0.38880.1030.128-0.80590.31820.0507-0.9999
(p-val)(0.3094 )(0.6175 )(0.4358 )(0.0284 )(0.1021 )(0.7926 )(0.1362 )
Estimates ( 2 )0.38530.10490.1237-0.79870.29940-1.0289
(p-val)(0.3623 )(0.6312 )(0.4614 )(0.051 )(0.2315 )(NA )(0.64 )
Estimates ( 3 )0.40120.08260.1493-0.8509-0.352800
(p-val)(0.0715 )(0.6071 )(0.3064 )(0 )(0.007 )(NA )(NA )
Estimates ( 4 )0.347600.1432-0.7791-0.353600
(p-val)(0.301 )(NA )(0.3818 )(0.0071 )(0.0066 )(NA )(NA )
Estimates ( 5 )0.145300-0.5846-0.346200
(p-val)(0.6512 )(NA )(NA )(0.0378 )(0.0082 )(NA )(NA )
Estimates ( 6 )000-0.4653-0.346500
(p-val)(NA )(NA )(NA )(3e-04 )(0.0083 )(NA )(NA )
Estimates ( 7 )NANANANANANANA
(p-val)(NA )(NA )(NA )(NA )(NA )(NA )(NA )
Estimates ( 8 )NANANANANANANA
(p-val)(NA )(NA )(NA )(NA )(NA )(NA )(NA )
Estimates ( 9 )NANANANANANANA
(p-val)(NA )(NA )(NA )(NA )(NA )(NA )(NA )
Estimates ( 10 )NANANANANANANA
(p-val)(NA )(NA )(NA )(NA )(NA )(NA )(NA )
Estimates ( 11 )NANANANANANANA
(p-val)(NA )(NA )(NA )(NA )(NA )(NA )(NA )
Estimates ( 12 )NANANANANANANA
(p-val)(NA )(NA )(NA )(NA )(NA )(NA )(NA )
Estimates ( 13 )NANANANANANANA
(p-val)(NA )(NA )(NA )(NA )(NA )(NA )(NA )

\begin{tabular}{lllllllll}
\hline
ARIMA Parameter Estimation and Backward Selection \tabularnewline
Iteration & ar1 & ar2 & ar3 & ma1 & sar1 & sar2 & sma1 \tabularnewline
Estimates ( 1 ) & 0.3888 & 0.103 & 0.128 & -0.8059 & 0.3182 & 0.0507 & -0.9999 \tabularnewline
(p-val) & (0.3094 ) & (0.6175 ) & (0.4358 ) & (0.0284 ) & (0.1021 ) & (0.7926 ) & (0.1362 ) \tabularnewline
Estimates ( 2 ) & 0.3853 & 0.1049 & 0.1237 & -0.7987 & 0.2994 & 0 & -1.0289 \tabularnewline
(p-val) & (0.3623 ) & (0.6312 ) & (0.4614 ) & (0.051 ) & (0.2315 ) & (NA ) & (0.64 ) \tabularnewline
Estimates ( 3 ) & 0.4012 & 0.0826 & 0.1493 & -0.8509 & -0.3528 & 0 & 0 \tabularnewline
(p-val) & (0.0715 ) & (0.6071 ) & (0.3064 ) & (0 ) & (0.007 ) & (NA ) & (NA ) \tabularnewline
Estimates ( 4 ) & 0.3476 & 0 & 0.1432 & -0.7791 & -0.3536 & 0 & 0 \tabularnewline
(p-val) & (0.301 ) & (NA ) & (0.3818 ) & (0.0071 ) & (0.0066 ) & (NA ) & (NA ) \tabularnewline
Estimates ( 5 ) & 0.1453 & 0 & 0 & -0.5846 & -0.3462 & 0 & 0 \tabularnewline
(p-val) & (0.6512 ) & (NA ) & (NA ) & (0.0378 ) & (0.0082 ) & (NA ) & (NA ) \tabularnewline
Estimates ( 6 ) & 0 & 0 & 0 & -0.4653 & -0.3465 & 0 & 0 \tabularnewline
(p-val) & (NA ) & (NA ) & (NA ) & (3e-04 ) & (0.0083 ) & (NA ) & (NA ) \tabularnewline
Estimates ( 7 ) & NA & NA & NA & NA & NA & NA & NA \tabularnewline
(p-val) & (NA ) & (NA ) & (NA ) & (NA ) & (NA ) & (NA ) & (NA ) \tabularnewline
Estimates ( 8 ) & NA & NA & NA & NA & NA & NA & NA \tabularnewline
(p-val) & (NA ) & (NA ) & (NA ) & (NA ) & (NA ) & (NA ) & (NA ) \tabularnewline
Estimates ( 9 ) & NA & NA & NA & NA & NA & NA & NA \tabularnewline
(p-val) & (NA ) & (NA ) & (NA ) & (NA ) & (NA ) & (NA ) & (NA ) \tabularnewline
Estimates ( 10 ) & NA & NA & NA & NA & NA & NA & NA \tabularnewline
(p-val) & (NA ) & (NA ) & (NA ) & (NA ) & (NA ) & (NA ) & (NA ) \tabularnewline
Estimates ( 11 ) & NA & NA & NA & NA & NA & NA & NA \tabularnewline
(p-val) & (NA ) & (NA ) & (NA ) & (NA ) & (NA ) & (NA ) & (NA ) \tabularnewline
Estimates ( 12 ) & NA & NA & NA & NA & NA & NA & NA \tabularnewline
(p-val) & (NA ) & (NA ) & (NA ) & (NA ) & (NA ) & (NA ) & (NA ) \tabularnewline
Estimates ( 13 ) & NA & NA & NA & NA & NA & NA & NA \tabularnewline
(p-val) & (NA ) & (NA ) & (NA ) & (NA ) & (NA ) & (NA ) & (NA ) \tabularnewline
\hline
\end{tabular}
%Source: https://freestatistics.org/blog/index.php?pk=196549&T=1

[TABLE]
[ROW][C]ARIMA Parameter Estimation and Backward Selection[/C][/ROW]
[ROW][C]Iteration[/C][C]ar1[/C][C]ar2[/C][C]ar3[/C][C]ma1[/C][C]sar1[/C][C]sar2[/C][C]sma1[/C][/ROW]
[ROW][C]Estimates ( 1 )[/C][C]0.3888[/C][C]0.103[/C][C]0.128[/C][C]-0.8059[/C][C]0.3182[/C][C]0.0507[/C][C]-0.9999[/C][/ROW]
[ROW][C](p-val)[/C][C](0.3094 )[/C][C](0.6175 )[/C][C](0.4358 )[/C][C](0.0284 )[/C][C](0.1021 )[/C][C](0.7926 )[/C][C](0.1362 )[/C][/ROW]
[ROW][C]Estimates ( 2 )[/C][C]0.3853[/C][C]0.1049[/C][C]0.1237[/C][C]-0.7987[/C][C]0.2994[/C][C]0[/C][C]-1.0289[/C][/ROW]
[ROW][C](p-val)[/C][C](0.3623 )[/C][C](0.6312 )[/C][C](0.4614 )[/C][C](0.051 )[/C][C](0.2315 )[/C][C](NA )[/C][C](0.64 )[/C][/ROW]
[ROW][C]Estimates ( 3 )[/C][C]0.4012[/C][C]0.0826[/C][C]0.1493[/C][C]-0.8509[/C][C]-0.3528[/C][C]0[/C][C]0[/C][/ROW]
[ROW][C](p-val)[/C][C](0.0715 )[/C][C](0.6071 )[/C][C](0.3064 )[/C][C](0 )[/C][C](0.007 )[/C][C](NA )[/C][C](NA )[/C][/ROW]
[ROW][C]Estimates ( 4 )[/C][C]0.3476[/C][C]0[/C][C]0.1432[/C][C]-0.7791[/C][C]-0.3536[/C][C]0[/C][C]0[/C][/ROW]
[ROW][C](p-val)[/C][C](0.301 )[/C][C](NA )[/C][C](0.3818 )[/C][C](0.0071 )[/C][C](0.0066 )[/C][C](NA )[/C][C](NA )[/C][/ROW]
[ROW][C]Estimates ( 5 )[/C][C]0.1453[/C][C]0[/C][C]0[/C][C]-0.5846[/C][C]-0.3462[/C][C]0[/C][C]0[/C][/ROW]
[ROW][C](p-val)[/C][C](0.6512 )[/C][C](NA )[/C][C](NA )[/C][C](0.0378 )[/C][C](0.0082 )[/C][C](NA )[/C][C](NA )[/C][/ROW]
[ROW][C]Estimates ( 6 )[/C][C]0[/C][C]0[/C][C]0[/C][C]-0.4653[/C][C]-0.3465[/C][C]0[/C][C]0[/C][/ROW]
[ROW][C](p-val)[/C][C](NA )[/C][C](NA )[/C][C](NA )[/C][C](3e-04 )[/C][C](0.0083 )[/C][C](NA )[/C][C](NA )[/C][/ROW]
[ROW][C]Estimates ( 7 )[/C][C]NA[/C][C]NA[/C][C]NA[/C][C]NA[/C][C]NA[/C][C]NA[/C][C]NA[/C][/ROW]
[ROW][C](p-val)[/C][C](NA )[/C][C](NA )[/C][C](NA )[/C][C](NA )[/C][C](NA )[/C][C](NA )[/C][C](NA )[/C][/ROW]
[ROW][C]Estimates ( 8 )[/C][C]NA[/C][C]NA[/C][C]NA[/C][C]NA[/C][C]NA[/C][C]NA[/C][C]NA[/C][/ROW]
[ROW][C](p-val)[/C][C](NA )[/C][C](NA )[/C][C](NA )[/C][C](NA )[/C][C](NA )[/C][C](NA )[/C][C](NA )[/C][/ROW]
[ROW][C]Estimates ( 9 )[/C][C]NA[/C][C]NA[/C][C]NA[/C][C]NA[/C][C]NA[/C][C]NA[/C][C]NA[/C][/ROW]
[ROW][C](p-val)[/C][C](NA )[/C][C](NA )[/C][C](NA )[/C][C](NA )[/C][C](NA )[/C][C](NA )[/C][C](NA )[/C][/ROW]
[ROW][C]Estimates ( 10 )[/C][C]NA[/C][C]NA[/C][C]NA[/C][C]NA[/C][C]NA[/C][C]NA[/C][C]NA[/C][/ROW]
[ROW][C](p-val)[/C][C](NA )[/C][C](NA )[/C][C](NA )[/C][C](NA )[/C][C](NA )[/C][C](NA )[/C][C](NA )[/C][/ROW]
[ROW][C]Estimates ( 11 )[/C][C]NA[/C][C]NA[/C][C]NA[/C][C]NA[/C][C]NA[/C][C]NA[/C][C]NA[/C][/ROW]
[ROW][C](p-val)[/C][C](NA )[/C][C](NA )[/C][C](NA )[/C][C](NA )[/C][C](NA )[/C][C](NA )[/C][C](NA )[/C][/ROW]
[ROW][C]Estimates ( 12 )[/C][C]NA[/C][C]NA[/C][C]NA[/C][C]NA[/C][C]NA[/C][C]NA[/C][C]NA[/C][/ROW]
[ROW][C](p-val)[/C][C](NA )[/C][C](NA )[/C][C](NA )[/C][C](NA )[/C][C](NA )[/C][C](NA )[/C][C](NA )[/C][/ROW]
[ROW][C]Estimates ( 13 )[/C][C]NA[/C][C]NA[/C][C]NA[/C][C]NA[/C][C]NA[/C][C]NA[/C][C]NA[/C][/ROW]
[ROW][C](p-val)[/C][C](NA )[/C][C](NA )[/C][C](NA )[/C][C](NA )[/C][C](NA )[/C][C](NA )[/C][C](NA )[/C][/ROW]
[/TABLE]
Source: https://freestatistics.org/blog/index.php?pk=196549&T=1

Globally Unique Identifier (entire table): ba.freestatistics.org/blog/index.php?pk=196549&T=1

As an alternative you can also use a QR Code:  

The GUIDs for individual cells are displayed in the table below:

ARIMA Parameter Estimation and Backward Selection
Iterationar1ar2ar3ma1sar1sar2sma1
Estimates ( 1 )0.38880.1030.128-0.80590.31820.0507-0.9999
(p-val)(0.3094 )(0.6175 )(0.4358 )(0.0284 )(0.1021 )(0.7926 )(0.1362 )
Estimates ( 2 )0.38530.10490.1237-0.79870.29940-1.0289
(p-val)(0.3623 )(0.6312 )(0.4614 )(0.051 )(0.2315 )(NA )(0.64 )
Estimates ( 3 )0.40120.08260.1493-0.8509-0.352800
(p-val)(0.0715 )(0.6071 )(0.3064 )(0 )(0.007 )(NA )(NA )
Estimates ( 4 )0.347600.1432-0.7791-0.353600
(p-val)(0.301 )(NA )(0.3818 )(0.0071 )(0.0066 )(NA )(NA )
Estimates ( 5 )0.145300-0.5846-0.346200
(p-val)(0.6512 )(NA )(NA )(0.0378 )(0.0082 )(NA )(NA )
Estimates ( 6 )000-0.4653-0.346500
(p-val)(NA )(NA )(NA )(3e-04 )(0.0083 )(NA )(NA )
Estimates ( 7 )NANANANANANANA
(p-val)(NA )(NA )(NA )(NA )(NA )(NA )(NA )
Estimates ( 8 )NANANANANANANA
(p-val)(NA )(NA )(NA )(NA )(NA )(NA )(NA )
Estimates ( 9 )NANANANANANANA
(p-val)(NA )(NA )(NA )(NA )(NA )(NA )(NA )
Estimates ( 10 )NANANANANANANA
(p-val)(NA )(NA )(NA )(NA )(NA )(NA )(NA )
Estimates ( 11 )NANANANANANANA
(p-val)(NA )(NA )(NA )(NA )(NA )(NA )(NA )
Estimates ( 12 )NANANANANANANA
(p-val)(NA )(NA )(NA )(NA )(NA )(NA )(NA )
Estimates ( 13 )NANANANANANANA
(p-val)(NA )(NA )(NA )(NA )(NA )(NA )(NA )


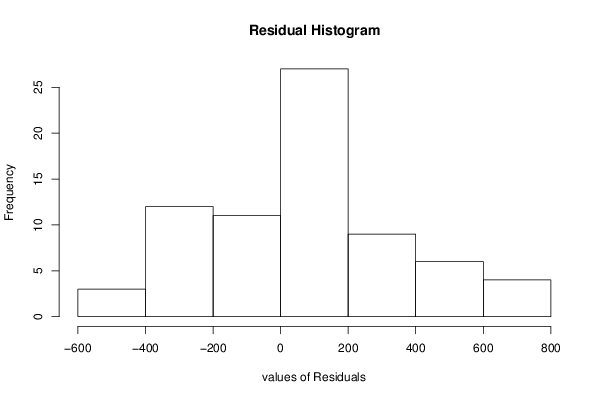
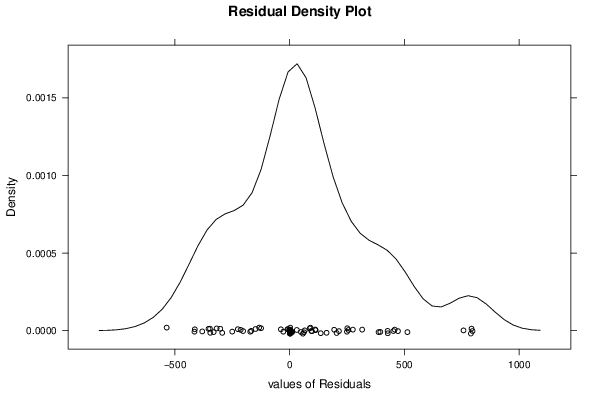
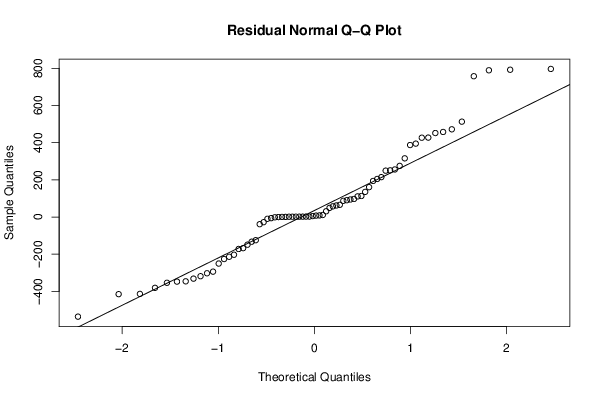
Estimated ARIMA Residuals
Value
-38.4461847117351
113.11157569364
255.807824542105
275.149609216011
-414.833380158155
-171.756292227383
10.9545173670425
249.347047127058
62.1266933074453
193.930831761076
426.587208129392
387.342611432892
796.481990250964
315.725700497566
31.1074871457349
-535.808472744989
792.165572610926
-318.273732119279
-124.574609815105
-148.838727659206
-347.277961417227
-345.755554840151
94.2988573843739
-9.47463445560796
427.287210508368
757.308806643704
-225.83952393358
135.219764319048
-331.336317759695
-213.660097581396
457.527136413806
-302.49819413507
-1.3598229481407
204.595926080055
-202.909123035029
789.35382067079
-132.775959075187
-380.842852767016
111.183978829777
394.844584892851
-27.7403533168322
160.68862671007
471.880873444075
-353.649442231667
97.1158621421853
214.582208765485
8.79705728309033
87.3055095117799
-250.271296856999
-413.426932465098
90.4530475833671
49.120193388336
251.161592912793
57.6259476077351
-167.351295344346
451.781336190016
512.970695838594
-293.826972792862
65.6932502597826
7.66162985321229

\begin{tabular}{lllllllll}
\hline
Estimated ARIMA Residuals \tabularnewline
Value \tabularnewline
-38.4461847117351 \tabularnewline
113.11157569364 \tabularnewline
255.807824542105 \tabularnewline
275.149609216011 \tabularnewline
-414.833380158155 \tabularnewline
-171.756292227383 \tabularnewline
10.9545173670425 \tabularnewline
249.347047127058 \tabularnewline
62.1266933074453 \tabularnewline
193.930831761076 \tabularnewline
426.587208129392 \tabularnewline
387.342611432892 \tabularnewline
796.481990250964 \tabularnewline
315.725700497566 \tabularnewline
31.1074871457349 \tabularnewline
-535.808472744989 \tabularnewline
792.165572610926 \tabularnewline
-318.273732119279 \tabularnewline
-124.574609815105 \tabularnewline
-148.838727659206 \tabularnewline
-347.277961417227 \tabularnewline
-345.755554840151 \tabularnewline
94.2988573843739 \tabularnewline
-9.47463445560796 \tabularnewline
427.287210508368 \tabularnewline
757.308806643704 \tabularnewline
-225.83952393358 \tabularnewline
135.219764319048 \tabularnewline
-331.336317759695 \tabularnewline
-213.660097581396 \tabularnewline
457.527136413806 \tabularnewline
-302.49819413507 \tabularnewline
-1.3598229481407 \tabularnewline
204.595926080055 \tabularnewline
-202.909123035029 \tabularnewline
789.35382067079 \tabularnewline
-132.775959075187 \tabularnewline
-380.842852767016 \tabularnewline
111.183978829777 \tabularnewline
394.844584892851 \tabularnewline
-27.7403533168322 \tabularnewline
160.68862671007 \tabularnewline
471.880873444075 \tabularnewline
-353.649442231667 \tabularnewline
97.1158621421853 \tabularnewline
214.582208765485 \tabularnewline
8.79705728309033 \tabularnewline
87.3055095117799 \tabularnewline
-250.271296856999 \tabularnewline
-413.426932465098 \tabularnewline
90.4530475833671 \tabularnewline
49.120193388336 \tabularnewline
251.161592912793 \tabularnewline
57.6259476077351 \tabularnewline
-167.351295344346 \tabularnewline
451.781336190016 \tabularnewline
512.970695838594 \tabularnewline
-293.826972792862 \tabularnewline
65.6932502597826 \tabularnewline
7.66162985321229 \tabularnewline
\hline
\end{tabular}
%Source: https://freestatistics.org/blog/index.php?pk=196549&T=2

[TABLE]
[ROW][C]Estimated ARIMA Residuals[/C][/ROW]
[ROW][C]Value[/C][/ROW]
[ROW][C]-38.4461847117351[/C][/ROW]
[ROW][C]113.11157569364[/C][/ROW]
[ROW][C]255.807824542105[/C][/ROW]
[ROW][C]275.149609216011[/C][/ROW]
[ROW][C]-414.833380158155[/C][/ROW]
[ROW][C]-171.756292227383[/C][/ROW]
[ROW][C]10.9545173670425[/C][/ROW]
[ROW][C]249.347047127058[/C][/ROW]
[ROW][C]62.1266933074453[/C][/ROW]
[ROW][C]193.930831761076[/C][/ROW]
[ROW][C]426.587208129392[/C][/ROW]
[ROW][C]387.342611432892[/C][/ROW]
[ROW][C]796.481990250964[/C][/ROW]
[ROW][C]315.725700497566[/C][/ROW]
[ROW][C]31.1074871457349[/C][/ROW]
[ROW][C]-535.808472744989[/C][/ROW]
[ROW][C]792.165572610926[/C][/ROW]
[ROW][C]-318.273732119279[/C][/ROW]
[ROW][C]-124.574609815105[/C][/ROW]
[ROW][C]-148.838727659206[/C][/ROW]
[ROW][C]-347.277961417227[/C][/ROW]
[ROW][C]-345.755554840151[/C][/ROW]
[ROW][C]94.2988573843739[/C][/ROW]
[ROW][C]-9.47463445560796[/C][/ROW]
[ROW][C]427.287210508368[/C][/ROW]
[ROW][C]757.308806643704[/C][/ROW]
[ROW][C]-225.83952393358[/C][/ROW]
[ROW][C]135.219764319048[/C][/ROW]
[ROW][C]-331.336317759695[/C][/ROW]
[ROW][C]-213.660097581396[/C][/ROW]
[ROW][C]457.527136413806[/C][/ROW]
[ROW][C]-302.49819413507[/C][/ROW]
[ROW][C]-1.3598229481407[/C][/ROW]
[ROW][C]204.595926080055[/C][/ROW]
[ROW][C]-202.909123035029[/C][/ROW]
[ROW][C]789.35382067079[/C][/ROW]
[ROW][C]-132.775959075187[/C][/ROW]
[ROW][C]-380.842852767016[/C][/ROW]
[ROW][C]111.183978829777[/C][/ROW]
[ROW][C]394.844584892851[/C][/ROW]
[ROW][C]-27.7403533168322[/C][/ROW]
[ROW][C]160.68862671007[/C][/ROW]
[ROW][C]471.880873444075[/C][/ROW]
[ROW][C]-353.649442231667[/C][/ROW]
[ROW][C]97.1158621421853[/C][/ROW]
[ROW][C]214.582208765485[/C][/ROW]
[ROW][C]8.79705728309033[/C][/ROW]
[ROW][C]87.3055095117799[/C][/ROW]
[ROW][C]-250.271296856999[/C][/ROW]
[ROW][C]-413.426932465098[/C][/ROW]
[ROW][C]90.4530475833671[/C][/ROW]
[ROW][C]49.120193388336[/C][/ROW]
[ROW][C]251.161592912793[/C][/ROW]
[ROW][C]57.6259476077351[/C][/ROW]
[ROW][C]-167.351295344346[/C][/ROW]
[ROW][C]451.781336190016[/C][/ROW]
[ROW][C]512.970695838594[/C][/ROW]
[ROW][C]-293.826972792862[/C][/ROW]
[ROW][C]65.6932502597826[/C][/ROW]
[ROW][C]7.66162985321229[/C][/ROW]
[/TABLE]
Source: https://freestatistics.org/blog/index.php?pk=196549&T=2

Globally Unique Identifier (entire table): ba.freestatistics.org/blog/index.php?pk=196549&T=2

As an alternative you can also use a QR Code:  

The GUIDs for individual cells are displayed in the table below:

Estimated ARIMA Residuals
Value
-38.4461847117351
113.11157569364
255.807824542105
275.149609216011
-414.833380158155
-171.756292227383
10.9545173670425
249.347047127058
62.1266933074453
193.930831761076
426.587208129392
387.342611432892
796.481990250964
315.725700497566
31.1074871457349
-535.808472744989
792.165572610926
-318.273732119279
-124.574609815105
-148.838727659206
-347.277961417227
-345.755554840151
94.2988573843739
-9.47463445560796
427.287210508368
757.308806643704
-225.83952393358
135.219764319048
-331.336317759695
-213.660097581396
457.527136413806
-302.49819413507
-1.3598229481407
204.595926080055
-202.909123035029
789.35382067079
-132.775959075187
-380.842852767016
111.183978829777
394.844584892851
-27.7403533168322
160.68862671007
471.880873444075
-353.649442231667
97.1158621421853
214.582208765485
8.79705728309033
87.3055095117799
-250.271296856999
-413.426932465098
90.4530475833671
49.120193388336
251.161592912793
57.6259476077351
-167.351295344346
451.781336190016
512.970695838594
-293.826972792862
65.6932502597826
7.66162985321229


Parameters (Session):
par1 = FALSE ; par2 = 1 ; par3 = 1 ; par4 = 1 ; par5 = 12 ; par6 = 3 ; par7 = 1 ; par8 = 2 ; par9 = 1 ;
Parameters (R input):
par1 = FALSE ; par2 = 1 ; par3 = 1 ; par4 = 1 ; par5 = 12 ; par6 = 3 ; par7 = 1 ; par8 = 2 ; par9 = 1 ; par10 = ; par11 = ; par12 = ; par13 = ; par14 = ; par15 = ; par16 = ; par17 = ; par18 = ; par19 = ; par20 = ;
R code (references can be found in the software module):
library(lattice)
if (par1 == 'TRUE') par1 <- TRUE
if (par1 == 'FALSE') par1 <- FALSE
par2 <- as.numeric(par2) #Box-Cox lambda transformation parameter
par3 <- as.numeric(par3) #degree of non-seasonal differencing
par4 <- as.numeric(par4) #degree of seasonal differencing
par5 <- as.numeric(par5) #seasonal period
par6 <- as.numeric(par6) #degree (p) of the non-seasonal AR(p) polynomial
par7 <- as.numeric(par7) #degree (q) of the non-seasonal MA(q) polynomial
par8 <- as.numeric(par8) #degree (P) of the seasonal AR(P) polynomial
par9 <- as.numeric(par9) #degree (Q) of the seasonal MA(Q) polynomial
armaGR <- function(arima.out, names, n){
try1 <- arima.out$coef
try2 <- sqrt(diag(arima.out$var.coef))
try.data.frame <- data.frame(matrix(NA,ncol=4,nrow=length(names)))
dimnames(try.data.frame) <- list(names,c('coef','std','tstat','pv'))
try.data.frame[,1] <- try1
for(i in 1:length(try2)) try.data.frame[which(rownames(try.data.frame)==names(try2)[i]),2] <- try2[i]
try.data.frame[,3] <- try.data.frame[,1] / try.data.frame[,2]
try.data.frame[,4] <- round((1-pt(abs(try.data.frame[,3]),df=n-(length(try2)+1)))*2,5)
vector <- rep(NA,length(names))
vector[is.na(try.data.frame[,4])] <- 0
maxi <- which.max(try.data.frame[,4])
continue <- max(try.data.frame[,4],na.rm=TRUE) > .05
vector[maxi] <- 0
list(summary=try.data.frame,next.vector=vector,continue=continue)
}
arimaSelect <- function(series, order=c(13,0,0), seasonal=list(order=c(2,0,0),period=12), include.mean=F){
nrc <- order[1]+order[3]+seasonal$order[1]+seasonal$order[3]
coeff <- matrix(NA, nrow=nrc*2, ncol=nrc)
pval <- matrix(NA, nrow=nrc*2, ncol=nrc)
mylist <- rep(list(NULL), nrc)
names <- NULL
if(order[1] > 0) names <- paste('ar',1:order[1],sep='')
if(order[3] > 0) names <- c( names , paste('ma',1:order[3],sep='') )
if(seasonal$order[1] > 0) names <- c(names, paste('sar',1:seasonal$order[1],sep=''))
if(seasonal$order[3] > 0) names <- c(names, paste('sma',1:seasonal$order[3],sep=''))
arima.out <- arima(series, order=order, seasonal=seasonal, include.mean=include.mean, method='ML')
mylist[[1]] <- arima.out
last.arma <- armaGR(arima.out, names, length(series))
mystop <- FALSE
i <- 1
coeff[i,] <- last.arma[[1]][,1]
pval [i,] <- last.arma[[1]][,4]
i <- 2
aic <- arima.out$aic
while(!mystop){
mylist[[i]] <- arima.out
arima.out <- arima(series, order=order, seasonal=seasonal, include.mean=include.mean, method='ML', fixed=last.arma$next.vector)
aic <- c(aic, arima.out$aic)
last.arma <- armaGR(arima.out, names, length(series))
mystop <- !last.arma$continue
coeff[i,] <- last.arma[[1]][,1]
pval [i,] <- last.arma[[1]][,4]
i <- i+1
}
list(coeff, pval, mylist, aic=aic)
}
arimaSelectplot <- function(arimaSelect.out,noms,choix){
noms <- names(arimaSelect.out[[3]][[1]]$coef)
coeff <- arimaSelect.out[[1]]
k <- min(which(is.na(coeff[,1])))-1
coeff <- coeff[1:k,]
pval <- arimaSelect.out[[2]][1:k,]
aic <- arimaSelect.out$aic[1:k]
coeff[coeff==0] <- NA
n <- ncol(coeff)
if(missing(choix)) choix <- k
layout(matrix(c(1,1,1,2,
3,3,3,2,
3,3,3,4,
5,6,7,7),nr=4),
widths=c(10,35,45,15),
heights=c(30,30,15,15))
couleurs <- rainbow(75)[1:50]#(50)
ticks <- pretty(coeff)
par(mar=c(1,1,3,1))
plot(aic,k:1-.5,type='o',pch=21,bg='blue',cex=2,axes=F,lty=2,xpd=NA)
points(aic[choix],k-choix+.5,pch=21,cex=4,bg=2,xpd=NA)
title('aic',line=2)
par(mar=c(3,0,0,0))
plot(0,axes=F,xlab='',ylab='',xlim=range(ticks),ylim=c(.1,1))
rect(xleft = min(ticks) + (0:49)/50*(max(ticks)-min(ticks)),
xright = min(ticks) + (1:50)/50*(max(ticks)-min(ticks)),
ytop = rep(1,50),
ybottom= rep(0,50),col=couleurs,border=NA)
axis(1,ticks)
rect(xleft=min(ticks),xright=max(ticks),ytop=1,ybottom=0)
text(mean(coeff,na.rm=T),.5,'coefficients',cex=2,font=2)
par(mar=c(1,1,3,1))
image(1:n,1:k,t(coeff[k:1,]),axes=F,col=couleurs,zlim=range(ticks))
for(i in 1:n) for(j in 1:k) if(!is.na(coeff[j,i])) {
if(pval[j,i]<.01) symb = 'green'
else if( (pval[j,i]<.05) & (pval[j,i]>=.01)) symb = 'orange'
else if( (pval[j,i]<.1) & (pval[j,i]>=.05)) symb = 'red'
else symb = 'black'
polygon(c(i+.5 ,i+.2 ,i+.5 ,i+.5),
c(k-j+0.5,k-j+0.5,k-j+0.8,k-j+0.5),
col=symb)
if(j==choix) {
rect(xleft=i-.5,
xright=i+.5,
ybottom=k-j+1.5,
ytop=k-j+.5,
lwd=4)
text(i,
k-j+1,
round(coeff[j,i],2),
cex=1.2,
font=2)
}
else{
rect(xleft=i-.5,xright=i+.5,ybottom=k-j+1.5,ytop=k-j+.5)
text(i,k-j+1,round(coeff[j,i],2),cex=1.2,font=1)
}
}
axis(3,1:n,noms)
par(mar=c(0.5,0,0,0.5))
plot(0,axes=F,xlab='',ylab='',type='n',xlim=c(0,8),ylim=c(-.2,.8))
cols <- c('green','orange','red','black')
niv <- c('0','0.01','0.05','0.1')
for(i in 0:3){
polygon(c(1+2*i ,1+2*i ,1+2*i-.5 ,1+2*i),
c(.4 ,.7 , .4 , .4),
col=cols[i+1])
text(2*i,0.5,niv[i+1],cex=1.5)
}
text(8,.5,1,cex=1.5)
text(4,0,'p-value',cex=2)
box()
residus <- arimaSelect.out[[3]][[choix]]$res
par(mar=c(1,2,4,1))
acf(residus,main='')
title('acf',line=.5)
par(mar=c(1,2,4,1))
pacf(residus,main='')
title('pacf',line=.5)
par(mar=c(2,2,4,1))
qqnorm(residus,main='')
title('qq-norm',line=.5)
qqline(residus)
residus
}
if (par2 == 0) x <- log(x)
if (par2 != 0) x <- x^par2
(selection <- arimaSelect(x, order=c(par6,par3,par7), seasonal=list(order=c(par8,par4,par9), period=par5)))
bitmap(file='test1.png')
resid <- arimaSelectplot(selection)
dev.off()
resid
bitmap(file='test2.png')
acf(resid,length(resid)/2, main='Residual Autocorrelation Function')
dev.off()
bitmap(file='test3.png')
pacf(resid,length(resid)/2, main='Residual Partial Autocorrelation Function')
dev.off()
bitmap(file='test4.png')
cpgram(resid, main='Residual Cumulative Periodogram')
dev.off()
bitmap(file='test5.png')
hist(resid, main='Residual Histogram', xlab='values of Residuals')
dev.off()
bitmap(file='test6.png')
densityplot(~resid,col='black',main='Residual Density Plot', xlab='values of Residuals')
dev.off()
bitmap(file='test7.png')
qqnorm(resid, main='Residual Normal Q-Q Plot')
qqline(resid)
dev.off()
ncols <- length(selection[[1]][1,])
nrows <- length(selection[[2]][,1])-1
load(file='createtable')
a<-table.start()
a<-table.row.start(a)
a<-table.element(a,'ARIMA Parameter Estimation and Backward Selection', ncols+1,TRUE)
a<-table.row.end(a)
a<-table.row.start(a)
a<-table.element(a,'Iteration', header=TRUE)
for (i in 1:ncols) {
a<-table.element(a,names(selection[[3]][[1]]$coef)[i],header=TRUE)
}
a<-table.row.end(a)
for (j in 1:nrows) {
a<-table.row.start(a)
mydum <- 'Estimates ('
mydum <- paste(mydum,j)
mydum <- paste(mydum,')')
a<-table.element(a,mydum, header=TRUE)
for (i in 1:ncols) {
a<-table.element(a,round(selection[[1]][j,i],4))
}
a<-table.row.end(a)
a<-table.row.start(a)
a<-table.element(a,'(p-val)', header=TRUE)
for (i in 1:ncols) {
mydum <- '('
mydum <- paste(mydum,round(selection[[2]][j,i],4),sep='')
mydum <- paste(mydum,')')
a<-table.element(a,mydum)
}
a<-table.row.end(a)
}
a<-table.end(a)
table.save(a,file='mytable.tab')
a<-table.start()
a<-table.row.start(a)
a<-table.element(a,'Estimated ARIMA Residuals', 1,TRUE)
a<-table.row.end(a)
a<-table.row.start(a)
a<-table.element(a,'Value', 1,TRUE)
a<-table.row.end(a)
for (i in (par4*par5+par3):length(resid)) {
a<-table.row.start(a)
a<-table.element(a,resid[i])
a<-table.row.end(a)
}
a<-table.end(a)
table.save(a,file='mytable1.tab')