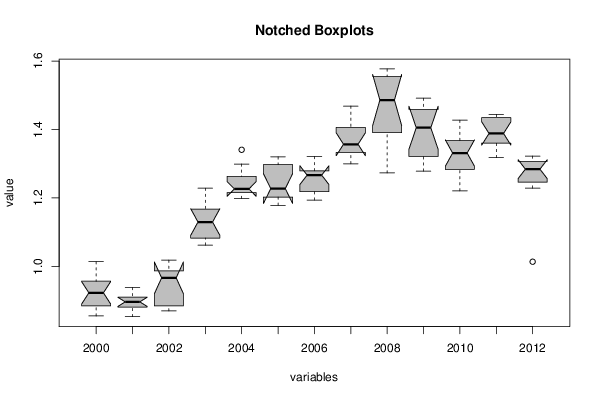
| Boxplot statistics |
| Variable | lower whisker | lower hinge | median | upper hinge | upper whisker |
| 2000 | 0.8552 | 0.8847 | 0.92285 | 0.95675 | 1.0137 |
| 2001 | 0.8532 | 0.88125 | 0.89645 | 0.9103 | 0.9383 |
| 2002 | 0.87 | 0.88455 | 0.9666 | 0.98665 | 1.0183 |
| 2003 | 1.0622 | 1.08275 | 1.1297 | 1.16775 | 1.2286 |
| 2004 | 1.1985 | 1.2157 | 1.2264 | 1.26295 | 1.2991 |
| 2005 | 1.1786 | 1.2026 | 1.2274 | 1.2976 | 1.3201 |
| 2006 | 1.1938 | 1.2187 | 1.2667 | 1.27905 | 1.3213 |
| 2007 | 1.2999 | 1.33305 | 1.3569 | 1.40615 | 1.4684 |
| 2008 | 1.2732 | 1.3909 | 1.48615 | 1.5555 | 1.577 |
| 2009 | 1.2785 | 1.32145 | 1.4052 | 1.4588 | 1.4914 |
| 2010 | 1.2208 | 1.2832 | 1.3313 | 1.36735 | 1.4272 |
| 2011 | 1.3179 | 1.36025 | 1.38845 | 1.4346 | 1.4442 |
| 2012 | 1.2288 | 1.2463 | 1.2842 | 1.3068 | 1.3224 |
| Boxplot Notches |
| Variable | lower bound | median | upper bound |
| 2000 | 0.889987511352861 | 0.92285 | 0.955712488647139 |
| 2001 | 0.883200099997233 | 0.89645 | 0.909699900002767 |
| 2002 | 0.920031504637434 | 0.9666 | 1.01316849536257 |
| 2003 | 1.09093092942392 | 1.1297 | 1.16846907057608 |
| 2004 | 1.20484895782682 | 1.2264 | 1.24795104217318 |
| 2005 | 1.18406986229732 | 1.2274 | 1.27073013770268 |
| 2006 | 1.23917395989098 | 1.2667 | 1.29422604010902 |
| 2007 | 1.32355859930457 | 1.3569 | 1.39024140069543 |
| 2008 | 1.4110748350962 | 1.48615 | 1.5612251649038 |
| 2009 | 1.34255374301618 | 1.4052 | 1.46784625698382 |
| 2010 | 1.29291862012968 | 1.3313 | 1.36968137987032 |
| 2011 | 1.35453846591374 | 1.38845 | 1.42236153408626 |
| 2012 | 1.25660554388408 | 1.2842 | 1.31179445611592 |