Free Statistics

of Irreproducible Research!

Author's title

Author*The author of this computation has been verified*
R Software Modulerwasp_arimabackwardselection.wasp
Title produced by softwareARIMA Backward Selection
Date of computationSun, 02 Dec 2012 06:52:41 -0500
Cite this page as followsStatistical Computations at FreeStatistics.org, Office for Research Development and Education, URL https://freestatistics.org/blog/index.php?v=date/2012/Dec/02/t1354449200hpzzh9i76ick3g4.htm/, Retrieved Thu, 25 Apr 2024 04:23:23 +0000
Statistical Computations at FreeStatistics.org, Office for Research Development and Education, URL https://freestatistics.org/blog/index.php?pk=195453, Retrieved Thu, 25 Apr 2024 04:23:23 +0000
QR Codes:

Original text written by user:
IsPrivate?No (this computation is public)
User-defined keywords
Estimated Impact121
Family? (F = Feedback message, R = changed R code, M = changed R Module, P = changed Parameters, D = changed Data)
-     [Univariate Data Series] [data set] [2008-12-01 19:54:57] [b98453cac15ba1066b407e146608df68]
- RMP   [Standard Deviation-Mean Plot] [Unemployment] [2010-11-29 10:34:47] [b98453cac15ba1066b407e146608df68]
- RMPD      [ARIMA Backward Selection] [ws9] [2012-12-02 11:52:41] [2bcb0f1dab9cffb75c9fd882cacbd29a] [Current]
Feedback Forum

Post a new message
Dataseries X:
88.1
101.7
114.8
103.4
96.4
110
71.1
79.4
119.2
99.1
113.2
103.6
97.5
102.4
120.8
89.5
101.7
112.5
72.4
84.7
117.2
112.8
111.3
102.3
95.2
103
116.4
95.1
100.7
112.4
75.3
93.3
118.6
118.7
110.7
113.3
89.5
106.3
115.1
105.7
95.8
114.7
79.6
80.6
125
127.5
99.5
104.3
90
96
108.9
95.8
87.2
108.4
74.9
80.8
119.1
107.9
106.9
96.8
93.7
95.2
112.7
98.5
91.5
112
76.7
84.7
114.9
108.4
104.6
111.3
90.8
109.1
121
95.2
110.5
102.4
86.7
99.1
126
110.3
104.6
103.1
102


Summary of computational transaction
Raw Inputview raw input (R code)
Raw Outputview raw output of R engine
Computing time5 seconds
R Server'Herman Ole Andreas Wold' @ wold.wessa.net

\begin{tabular}{lllllllll}
\hline
Summary of computational transaction \tabularnewline
Raw Input & view raw input (R code)  \tabularnewline
Raw Output & view raw output of R engine  \tabularnewline
Computing time & 5 seconds \tabularnewline
R Server & 'Herman Ole Andreas Wold' @ wold.wessa.net \tabularnewline
\hline
\end{tabular}
%Source: https://freestatistics.org/blog/index.php?pk=195453&T=0

[TABLE]
[ROW][C]Summary of computational transaction[/C][/ROW]
[ROW][C]Raw Input[/C][C]view raw input (R code) [/C][/ROW]
[ROW][C]Raw Output[/C][C]view raw output of R engine [/C][/ROW]
[ROW][C]Computing time[/C][C]5 seconds[/C][/ROW]
[ROW][C]R Server[/C][C]'Herman Ole Andreas Wold' @ wold.wessa.net[/C][/ROW]
[/TABLE]
Source: https://freestatistics.org/blog/index.php?pk=195453&T=0

Globally Unique Identifier (entire table): ba.freestatistics.org/blog/index.php?pk=195453&T=0

As an alternative you can also use a QR Code:  

The GUIDs for individual cells are displayed in the table below:

Summary of computational transaction
Raw Inputview raw input (R code)
Raw Outputview raw output of R engine
Computing time5 seconds
R Server'Herman Ole Andreas Wold' @ wold.wessa.net


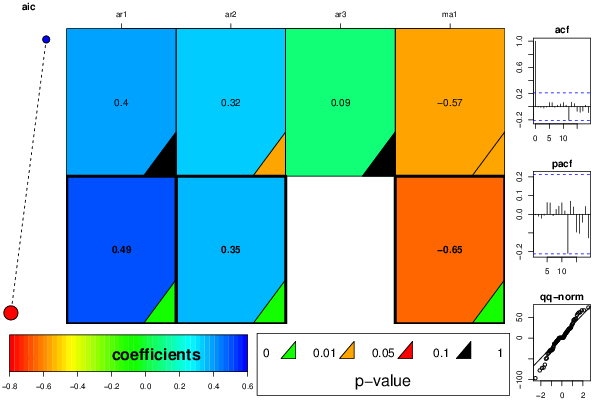
ARIMA Parameter Estimation and Backward Selection
Iterationar1ar2ar3ma1
Estimates ( 1 )0.39540.32380.0892-0.574
(p-val)(0.1205 )(0.01 )(0.5619 )(0.0136 )
Estimates ( 2 )0.49080.35410-0.6507
(p-val)(0.0038 )(0.0026 )(NA )(0 )
Estimates ( 3 )NANANANA
(p-val)(NA )(NA )(NA )(NA )
Estimates ( 4 )NANANANA
(p-val)(NA )(NA )(NA )(NA )
Estimates ( 5 )NANANANA
(p-val)(NA )(NA )(NA )(NA )
Estimates ( 6 )NANANANA
(p-val)(NA )(NA )(NA )(NA )
Estimates ( 7 )NANANANA
(p-val)(NA )(NA )(NA )(NA )

\begin{tabular}{lllllllll}
\hline
ARIMA Parameter Estimation and Backward Selection \tabularnewline
Iteration & ar1 & ar2 & ar3 & ma1 \tabularnewline
Estimates ( 1 ) & 0.3954 & 0.3238 & 0.0892 & -0.574 \tabularnewline
(p-val) & (0.1205 ) & (0.01 ) & (0.5619 ) & (0.0136 ) \tabularnewline
Estimates ( 2 ) & 0.4908 & 0.3541 & 0 & -0.6507 \tabularnewline
(p-val) & (0.0038 ) & (0.0026 ) & (NA ) & (0 ) \tabularnewline
Estimates ( 3 ) & NA & NA & NA & NA \tabularnewline
(p-val) & (NA ) & (NA ) & (NA ) & (NA ) \tabularnewline
Estimates ( 4 ) & NA & NA & NA & NA \tabularnewline
(p-val) & (NA ) & (NA ) & (NA ) & (NA ) \tabularnewline
Estimates ( 5 ) & NA & NA & NA & NA \tabularnewline
(p-val) & (NA ) & (NA ) & (NA ) & (NA ) \tabularnewline
Estimates ( 6 ) & NA & NA & NA & NA \tabularnewline
(p-val) & (NA ) & (NA ) & (NA ) & (NA ) \tabularnewline
Estimates ( 7 ) & NA & NA & NA & NA \tabularnewline
(p-val) & (NA ) & (NA ) & (NA ) & (NA ) \tabularnewline
\hline
\end{tabular}
%Source: https://freestatistics.org/blog/index.php?pk=195453&T=1

[TABLE]
[ROW][C]ARIMA Parameter Estimation and Backward Selection[/C][/ROW]
[ROW][C]Iteration[/C][C]ar1[/C][C]ar2[/C][C]ar3[/C][C]ma1[/C][/ROW]
[ROW][C]Estimates ( 1 )[/C][C]0.3954[/C][C]0.3238[/C][C]0.0892[/C][C]-0.574[/C][/ROW]
[ROW][C](p-val)[/C][C](0.1205 )[/C][C](0.01 )[/C][C](0.5619 )[/C][C](0.0136 )[/C][/ROW]
[ROW][C]Estimates ( 2 )[/C][C]0.4908[/C][C]0.3541[/C][C]0[/C][C]-0.6507[/C][/ROW]
[ROW][C](p-val)[/C][C](0.0038 )[/C][C](0.0026 )[/C][C](NA )[/C][C](0 )[/C][/ROW]
[ROW][C]Estimates ( 3 )[/C][C]NA[/C][C]NA[/C][C]NA[/C][C]NA[/C][/ROW]
[ROW][C](p-val)[/C][C](NA )[/C][C](NA )[/C][C](NA )[/C][C](NA )[/C][/ROW]
[ROW][C]Estimates ( 4 )[/C][C]NA[/C][C]NA[/C][C]NA[/C][C]NA[/C][/ROW]
[ROW][C](p-val)[/C][C](NA )[/C][C](NA )[/C][C](NA )[/C][C](NA )[/C][/ROW]
[ROW][C]Estimates ( 5 )[/C][C]NA[/C][C]NA[/C][C]NA[/C][C]NA[/C][/ROW]
[ROW][C](p-val)[/C][C](NA )[/C][C](NA )[/C][C](NA )[/C][C](NA )[/C][/ROW]
[ROW][C]Estimates ( 6 )[/C][C]NA[/C][C]NA[/C][C]NA[/C][C]NA[/C][/ROW]
[ROW][C](p-val)[/C][C](NA )[/C][C](NA )[/C][C](NA )[/C][C](NA )[/C][/ROW]
[ROW][C]Estimates ( 7 )[/C][C]NA[/C][C]NA[/C][C]NA[/C][C]NA[/C][/ROW]
[ROW][C](p-val)[/C][C](NA )[/C][C](NA )[/C][C](NA )[/C][C](NA )[/C][/ROW]
[/TABLE]
Source: https://freestatistics.org/blog/index.php?pk=195453&T=1

Globally Unique Identifier (entire table): ba.freestatistics.org/blog/index.php?pk=195453&T=1

As an alternative you can also use a QR Code:  

The GUIDs for individual cells are displayed in the table below:

ARIMA Parameter Estimation and Backward Selection
Iterationar1ar2ar3ma1
Estimates ( 1 )0.39540.32380.0892-0.574
(p-val)(0.1205 )(0.01 )(0.5619 )(0.0136 )
Estimates ( 2 )0.49080.35410-0.6507
(p-val)(0.0038 )(0.0026 )(NA )(0 )
Estimates ( 3 )NANANANA
(p-val)(NA )(NA )(NA )(NA )
Estimates ( 4 )NANANANA
(p-val)(NA )(NA )(NA )(NA )
Estimates ( 5 )NANANANA
(p-val)(NA )(NA )(NA )(NA )
Estimates ( 6 )NANANANA
(p-val)(NA )(NA )(NA )(NA )
Estimates ( 7 )NANANANA
(p-val)(NA )(NA )(NA )(NA )


Estimated ARIMA Residuals
Value
0.416837598055633
43.7957237163736
7.70425206683346
19.2906292826576
-77.8483515771288
0.469049985914188
22.9132692987848
11.4250348968799
23.2263042055973
-10.9374334842186
61.243939378612
-2.33102538079489
-26.4874352385967
-27.4266566821768
-4.85189188443094
-23.5725971296251
24.2758716191469
5.03447918362069
-2.61738851513556
11.5723247720562
44.8360724122963
11.964199621152
20.622053386094
-10.2801696943877
42.5775006783481
-29.1934021310162
-6.62209275901398
-13.5413736091531
46.8888831869693
-19.2952813651303
-5.89240547122068
15.6106117120957
-63.9602656648394
15.5687061270156
62.0803586589206
-48.1235736784358
-70.95882417638
-4.60659502650579
-36.4042248571921
-29.4940367712619
-38.0531577718491
-29.3533834245549
-13.8160329667499
1.49255254896668
25.5029288707512
-7.86673219935606
-96.4991841668567
35.7913494578295
3.75574949431252
33.1725580184073
16.7164887956946
28.9130261930542
22.0870016680824
22.5111090879961
17.3013125472786
2.71596381184198
9.10796620108264
-29.5837858144314
-12.2613027918232
-14.5121050223678
73.560157224658
1.23209423383076
55.3780493644322
46.143876780385
-30.3612317614945
66.8277744287852
-49.8920248485849
9.70462587115649
66.5922381746883
58.9899787611863
-7.92590615109143
-34.6907160307908
-71.9294678374235
32.2705812346649

\begin{tabular}{lllllllll}
\hline
Estimated ARIMA Residuals \tabularnewline
Value \tabularnewline
0.416837598055633 \tabularnewline
43.7957237163736 \tabularnewline
7.70425206683346 \tabularnewline
19.2906292826576 \tabularnewline
-77.8483515771288 \tabularnewline
0.469049985914188 \tabularnewline
22.9132692987848 \tabularnewline
11.4250348968799 \tabularnewline
23.2263042055973 \tabularnewline
-10.9374334842186 \tabularnewline
61.243939378612 \tabularnewline
-2.33102538079489 \tabularnewline
-26.4874352385967 \tabularnewline
-27.4266566821768 \tabularnewline
-4.85189188443094 \tabularnewline
-23.5725971296251 \tabularnewline
24.2758716191469 \tabularnewline
5.03447918362069 \tabularnewline
-2.61738851513556 \tabularnewline
11.5723247720562 \tabularnewline
44.8360724122963 \tabularnewline
11.964199621152 \tabularnewline
20.622053386094 \tabularnewline
-10.2801696943877 \tabularnewline
42.5775006783481 \tabularnewline
-29.1934021310162 \tabularnewline
-6.62209275901398 \tabularnewline
-13.5413736091531 \tabularnewline
46.8888831869693 \tabularnewline
-19.2952813651303 \tabularnewline
-5.89240547122068 \tabularnewline
15.6106117120957 \tabularnewline
-63.9602656648394 \tabularnewline
15.5687061270156 \tabularnewline
62.0803586589206 \tabularnewline
-48.1235736784358 \tabularnewline
-70.95882417638 \tabularnewline
-4.60659502650579 \tabularnewline
-36.4042248571921 \tabularnewline
-29.4940367712619 \tabularnewline
-38.0531577718491 \tabularnewline
-29.3533834245549 \tabularnewline
-13.8160329667499 \tabularnewline
1.49255254896668 \tabularnewline
25.5029288707512 \tabularnewline
-7.86673219935606 \tabularnewline
-96.4991841668567 \tabularnewline
35.7913494578295 \tabularnewline
3.75574949431252 \tabularnewline
33.1725580184073 \tabularnewline
16.7164887956946 \tabularnewline
28.9130261930542 \tabularnewline
22.0870016680824 \tabularnewline
22.5111090879961 \tabularnewline
17.3013125472786 \tabularnewline
2.71596381184198 \tabularnewline
9.10796620108264 \tabularnewline
-29.5837858144314 \tabularnewline
-12.2613027918232 \tabularnewline
-14.5121050223678 \tabularnewline
73.560157224658 \tabularnewline
1.23209423383076 \tabularnewline
55.3780493644322 \tabularnewline
46.143876780385 \tabularnewline
-30.3612317614945 \tabularnewline
66.8277744287852 \tabularnewline
-49.8920248485849 \tabularnewline
9.70462587115649 \tabularnewline
66.5922381746883 \tabularnewline
58.9899787611863 \tabularnewline
-7.92590615109143 \tabularnewline
-34.6907160307908 \tabularnewline
-71.9294678374235 \tabularnewline
32.2705812346649 \tabularnewline
\hline
\end{tabular}
%Source: https://freestatistics.org/blog/index.php?pk=195453&T=2

[TABLE]
[ROW][C]Estimated ARIMA Residuals[/C][/ROW]
[ROW][C]Value[/C][/ROW]
[ROW][C]0.416837598055633[/C][/ROW]
[ROW][C]43.7957237163736[/C][/ROW]
[ROW][C]7.70425206683346[/C][/ROW]
[ROW][C]19.2906292826576[/C][/ROW]
[ROW][C]-77.8483515771288[/C][/ROW]
[ROW][C]0.469049985914188[/C][/ROW]
[ROW][C]22.9132692987848[/C][/ROW]
[ROW][C]11.4250348968799[/C][/ROW]
[ROW][C]23.2263042055973[/C][/ROW]
[ROW][C]-10.9374334842186[/C][/ROW]
[ROW][C]61.243939378612[/C][/ROW]
[ROW][C]-2.33102538079489[/C][/ROW]
[ROW][C]-26.4874352385967[/C][/ROW]
[ROW][C]-27.4266566821768[/C][/ROW]
[ROW][C]-4.85189188443094[/C][/ROW]
[ROW][C]-23.5725971296251[/C][/ROW]
[ROW][C]24.2758716191469[/C][/ROW]
[ROW][C]5.03447918362069[/C][/ROW]
[ROW][C]-2.61738851513556[/C][/ROW]
[ROW][C]11.5723247720562[/C][/ROW]
[ROW][C]44.8360724122963[/C][/ROW]
[ROW][C]11.964199621152[/C][/ROW]
[ROW][C]20.622053386094[/C][/ROW]
[ROW][C]-10.2801696943877[/C][/ROW]
[ROW][C]42.5775006783481[/C][/ROW]
[ROW][C]-29.1934021310162[/C][/ROW]
[ROW][C]-6.62209275901398[/C][/ROW]
[ROW][C]-13.5413736091531[/C][/ROW]
[ROW][C]46.8888831869693[/C][/ROW]
[ROW][C]-19.2952813651303[/C][/ROW]
[ROW][C]-5.89240547122068[/C][/ROW]
[ROW][C]15.6106117120957[/C][/ROW]
[ROW][C]-63.9602656648394[/C][/ROW]
[ROW][C]15.5687061270156[/C][/ROW]
[ROW][C]62.0803586589206[/C][/ROW]
[ROW][C]-48.1235736784358[/C][/ROW]
[ROW][C]-70.95882417638[/C][/ROW]
[ROW][C]-4.60659502650579[/C][/ROW]
[ROW][C]-36.4042248571921[/C][/ROW]
[ROW][C]-29.4940367712619[/C][/ROW]
[ROW][C]-38.0531577718491[/C][/ROW]
[ROW][C]-29.3533834245549[/C][/ROW]
[ROW][C]-13.8160329667499[/C][/ROW]
[ROW][C]1.49255254896668[/C][/ROW]
[ROW][C]25.5029288707512[/C][/ROW]
[ROW][C]-7.86673219935606[/C][/ROW]
[ROW][C]-96.4991841668567[/C][/ROW]
[ROW][C]35.7913494578295[/C][/ROW]
[ROW][C]3.75574949431252[/C][/ROW]
[ROW][C]33.1725580184073[/C][/ROW]
[ROW][C]16.7164887956946[/C][/ROW]
[ROW][C]28.9130261930542[/C][/ROW]
[ROW][C]22.0870016680824[/C][/ROW]
[ROW][C]22.5111090879961[/C][/ROW]
[ROW][C]17.3013125472786[/C][/ROW]
[ROW][C]2.71596381184198[/C][/ROW]
[ROW][C]9.10796620108264[/C][/ROW]
[ROW][C]-29.5837858144314[/C][/ROW]
[ROW][C]-12.2613027918232[/C][/ROW]
[ROW][C]-14.5121050223678[/C][/ROW]
[ROW][C]73.560157224658[/C][/ROW]
[ROW][C]1.23209423383076[/C][/ROW]
[ROW][C]55.3780493644322[/C][/ROW]
[ROW][C]46.143876780385[/C][/ROW]
[ROW][C]-30.3612317614945[/C][/ROW]
[ROW][C]66.8277744287852[/C][/ROW]
[ROW][C]-49.8920248485849[/C][/ROW]
[ROW][C]9.70462587115649[/C][/ROW]
[ROW][C]66.5922381746883[/C][/ROW]
[ROW][C]58.9899787611863[/C][/ROW]
[ROW][C]-7.92590615109143[/C][/ROW]
[ROW][C]-34.6907160307908[/C][/ROW]
[ROW][C]-71.9294678374235[/C][/ROW]
[ROW][C]32.2705812346649[/C][/ROW]
[/TABLE]
Source: https://freestatistics.org/blog/index.php?pk=195453&T=2

Globally Unique Identifier (entire table): ba.freestatistics.org/blog/index.php?pk=195453&T=2

As an alternative you can also use a QR Code:  

The GUIDs for individual cells are displayed in the table below:

Estimated ARIMA Residuals
Value
0.416837598055633
43.7957237163736
7.70425206683346
19.2906292826576
-77.8483515771288
0.469049985914188
22.9132692987848
11.4250348968799
23.2263042055973
-10.9374334842186
61.243939378612
-2.33102538079489
-26.4874352385967
-27.4266566821768
-4.85189188443094
-23.5725971296251
24.2758716191469
5.03447918362069
-2.61738851513556
11.5723247720562
44.8360724122963
11.964199621152
20.622053386094
-10.2801696943877
42.5775006783481
-29.1934021310162
-6.62209275901398
-13.5413736091531
46.8888831869693
-19.2952813651303
-5.89240547122068
15.6106117120957
-63.9602656648394
15.5687061270156
62.0803586589206
-48.1235736784358
-70.95882417638
-4.60659502650579
-36.4042248571921
-29.4940367712619
-38.0531577718491
-29.3533834245549
-13.8160329667499
1.49255254896668
25.5029288707512
-7.86673219935606
-96.4991841668567
35.7913494578295
3.75574949431252
33.1725580184073
16.7164887956946
28.9130261930542
22.0870016680824
22.5111090879961
17.3013125472786
2.71596381184198
9.10796620108264
-29.5837858144314
-12.2613027918232
-14.5121050223678
73.560157224658
1.23209423383076
55.3780493644322
46.143876780385
-30.3612317614945
66.8277744287852
-49.8920248485849
9.70462587115649
66.5922381746883
58.9899787611863
-7.92590615109143
-34.6907160307908
-71.9294678374235
32.2705812346649


Parameters (Session):
par1 = FALSE ; par2 = 1.3 ; par3 = 0 ; par4 = 1 ; par5 = 12 ; par6 = 3 ; par7 = 1 ; par8 = 0 ; par9 = 0 ;
Parameters (R input):
par1 = FALSE ; par2 = 1.3 ; par3 = 0 ; par4 = 1 ; par5 = 12 ; par6 = 3 ; par7 = 1 ; par8 = 0 ; par9 = 0 ;
R code (references can be found in the software module):
library(lattice)
if (par1 == 'TRUE') par1 <- TRUE
if (par1 == 'FALSE') par1 <- FALSE
par2 <- as.numeric(par2) #Box-Cox lambda transformation parameter
par3 <- as.numeric(par3) #degree of non-seasonal differencing
par4 <- as.numeric(par4) #degree of seasonal differencing
par5 <- as.numeric(par5) #seasonal period
par6 <- as.numeric(par6) #degree (p) of the non-seasonal AR(p) polynomial
par7 <- as.numeric(par7) #degree (q) of the non-seasonal MA(q) polynomial
par8 <- as.numeric(par8) #degree (P) of the seasonal AR(P) polynomial
par9 <- as.numeric(par9) #degree (Q) of the seasonal MA(Q) polynomial
armaGR <- function(arima.out, names, n){
try1 <- arima.out$coef
try2 <- sqrt(diag(arima.out$var.coef))
try.data.frame <- data.frame(matrix(NA,ncol=4,nrow=length(names)))
dimnames(try.data.frame) <- list(names,c('coef','std','tstat','pv'))
try.data.frame[,1] <- try1
for(i in 1:length(try2)) try.data.frame[which(rownames(try.data.frame)==names(try2)[i]),2] <- try2[i]
try.data.frame[,3] <- try.data.frame[,1] / try.data.frame[,2]
try.data.frame[,4] <- round((1-pt(abs(try.data.frame[,3]),df=n-(length(try2)+1)))*2,5)
vector <- rep(NA,length(names))
vector[is.na(try.data.frame[,4])] <- 0
maxi <- which.max(try.data.frame[,4])
continue <- max(try.data.frame[,4],na.rm=TRUE) > .05
vector[maxi] <- 0
list(summary=try.data.frame,next.vector=vector,continue=continue)
}
arimaSelect <- function(series, order=c(13,0,0), seasonal=list(order=c(2,0,0),period=12), include.mean=F){
nrc <- order[1]+order[3]+seasonal$order[1]+seasonal$order[3]
coeff <- matrix(NA, nrow=nrc*2, ncol=nrc)
pval <- matrix(NA, nrow=nrc*2, ncol=nrc)
mylist <- rep(list(NULL), nrc)
names <- NULL
if(order[1] > 0) names <- paste('ar',1:order[1],sep='')
if(order[3] > 0) names <- c( names , paste('ma',1:order[3],sep='') )
if(seasonal$order[1] > 0) names <- c(names, paste('sar',1:seasonal$order[1],sep=''))
if(seasonal$order[3] > 0) names <- c(names, paste('sma',1:seasonal$order[3],sep=''))
arima.out <- arima(series, order=order, seasonal=seasonal, include.mean=include.mean, method='ML')
mylist[[1]] <- arima.out
last.arma <- armaGR(arima.out, names, length(series))
mystop <- FALSE
i <- 1
coeff[i,] <- last.arma[[1]][,1]
pval [i,] <- last.arma[[1]][,4]
i <- 2
aic <- arima.out$aic
while(!mystop){
mylist[[i]] <- arima.out
arima.out <- arima(series, order=order, seasonal=seasonal, include.mean=include.mean, method='ML', fixed=last.arma$next.vector)
aic <- c(aic, arima.out$aic)
last.arma <- armaGR(arima.out, names, length(series))
mystop <- !last.arma$continue
coeff[i,] <- last.arma[[1]][,1]
pval [i,] <- last.arma[[1]][,4]
i <- i+1
}
list(coeff, pval, mylist, aic=aic)
}
arimaSelectplot <- function(arimaSelect.out,noms,choix){
noms <- names(arimaSelect.out[[3]][[1]]$coef)
coeff <- arimaSelect.out[[1]]
k <- min(which(is.na(coeff[,1])))-1
coeff <- coeff[1:k,]
pval <- arimaSelect.out[[2]][1:k,]
aic <- arimaSelect.out$aic[1:k]
coeff[coeff==0] <- NA
n <- ncol(coeff)
if(missing(choix)) choix <- k
layout(matrix(c(1,1,1,2,
3,3,3,2,
3,3,3,4,
5,6,7,7),nr=4),
widths=c(10,35,45,15),
heights=c(30,30,15,15))
couleurs <- rainbow(75)[1:50]#(50)
ticks <- pretty(coeff)
par(mar=c(1,1,3,1))
plot(aic,k:1-.5,type='o',pch=21,bg='blue',cex=2,axes=F,lty=2,xpd=NA)
points(aic[choix],k-choix+.5,pch=21,cex=4,bg=2,xpd=NA)
title('aic',line=2)
par(mar=c(3,0,0,0))
plot(0,axes=F,xlab='',ylab='',xlim=range(ticks),ylim=c(.1,1))
rect(xleft = min(ticks) + (0:49)/50*(max(ticks)-min(ticks)),
xright = min(ticks) + (1:50)/50*(max(ticks)-min(ticks)),
ytop = rep(1,50),
ybottom= rep(0,50),col=couleurs,border=NA)
axis(1,ticks)
rect(xleft=min(ticks),xright=max(ticks),ytop=1,ybottom=0)
text(mean(coeff,na.rm=T),.5,'coefficients',cex=2,font=2)
par(mar=c(1,1,3,1))
image(1:n,1:k,t(coeff[k:1,]),axes=F,col=couleurs,zlim=range(ticks))
for(i in 1:n) for(j in 1:k) if(!is.na(coeff[j,i])) {
if(pval[j,i]<.01) symb = 'green'
else if( (pval[j,i]<.05) & (pval[j,i]>=.01)) symb = 'orange'
else if( (pval[j,i]<.1) & (pval[j,i]>=.05)) symb = 'red'
else symb = 'black'
polygon(c(i+.5 ,i+.2 ,i+.5 ,i+.5),
c(k-j+0.5,k-j+0.5,k-j+0.8,k-j+0.5),
col=symb)
if(j==choix) {
rect(xleft=i-.5,
xright=i+.5,
ybottom=k-j+1.5,
ytop=k-j+.5,
lwd=4)
text(i,
k-j+1,
round(coeff[j,i],2),
cex=1.2,
font=2)
}
else{
rect(xleft=i-.5,xright=i+.5,ybottom=k-j+1.5,ytop=k-j+.5)
text(i,k-j+1,round(coeff[j,i],2),cex=1.2,font=1)
}
}
axis(3,1:n,noms)
par(mar=c(0.5,0,0,0.5))
plot(0,axes=F,xlab='',ylab='',type='n',xlim=c(0,8),ylim=c(-.2,.8))
cols <- c('green','orange','red','black')
niv <- c('0','0.01','0.05','0.1')
for(i in 0:3){
polygon(c(1+2*i ,1+2*i ,1+2*i-.5 ,1+2*i),
c(.4 ,.7 , .4 , .4),
col=cols[i+1])
text(2*i,0.5,niv[i+1],cex=1.5)
}
text(8,.5,1,cex=1.5)
text(4,0,'p-value',cex=2)
box()
residus <- arimaSelect.out[[3]][[choix]]$res
par(mar=c(1,2,4,1))
acf(residus,main='')
title('acf',line=.5)
par(mar=c(1,2,4,1))
pacf(residus,main='')
title('pacf',line=.5)
par(mar=c(2,2,4,1))
qqnorm(residus,main='')
title('qq-norm',line=.5)
qqline(residus)
residus
}
if (par2 == 0) x <- log(x)
if (par2 != 0) x <- x^par2
(selection <- arimaSelect(x, order=c(par6,par3,par7), seasonal=list(order=c(par8,par4,par9), period=par5)))
bitmap(file='test1.png')
resid <- arimaSelectplot(selection)
dev.off()
resid
bitmap(file='test2.png')
acf(resid,length(resid)/2, main='Residual Autocorrelation Function')
dev.off()
bitmap(file='test3.png')
pacf(resid,length(resid)/2, main='Residual Partial Autocorrelation Function')
dev.off()
bitmap(file='test4.png')
cpgram(resid, main='Residual Cumulative Periodogram')
dev.off()
bitmap(file='test5.png')
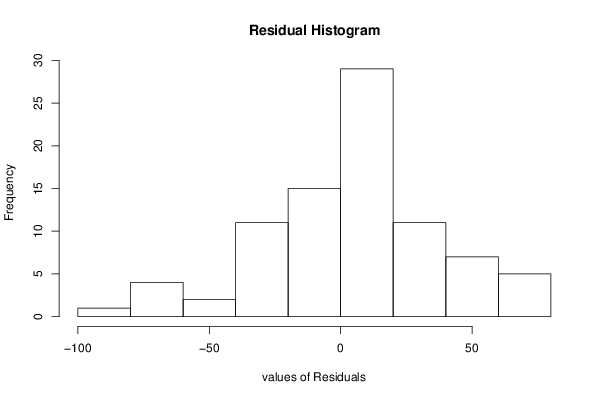
hist(resid, main='Residual Histogram', xlab='values of Residuals')
dev.off()
bitmap(file='test6.png')
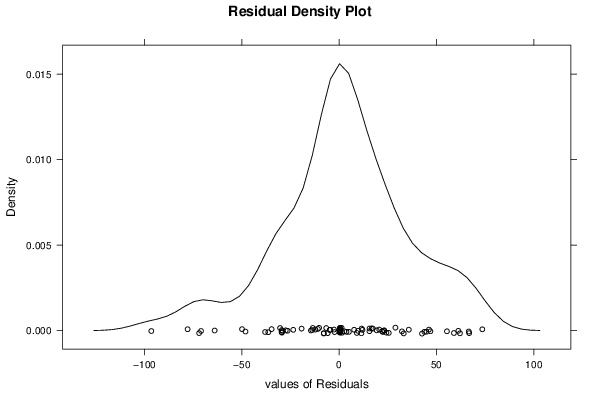
densityplot(~resid,col='black',main='Residual Density Plot', xlab='values of Residuals')
dev.off()
bitmap(file='test7.png')
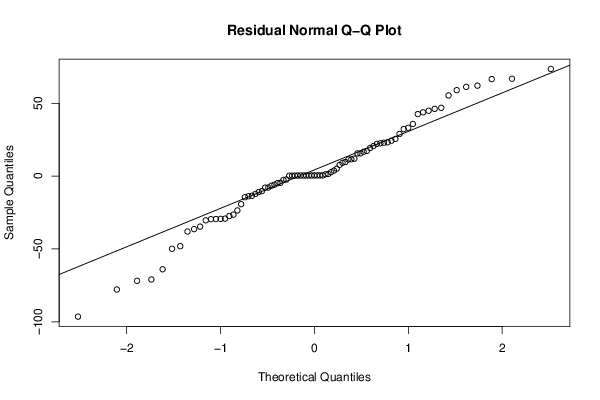
qqnorm(resid, main='Residual Normal Q-Q Plot')
qqline(resid)
dev.off()
ncols <- length(selection[[1]][1,])
nrows <- length(selection[[2]][,1])-1
load(file='createtable')
a<-table.start()
a<-table.row.start(a)
a<-table.element(a,'ARIMA Parameter Estimation and Backward Selection', ncols+1,TRUE)
a<-table.row.end(a)
a<-table.row.start(a)
a<-table.element(a,'Iteration', header=TRUE)
for (i in 1:ncols) {
a<-table.element(a,names(selection[[3]][[1]]$coef)[i],header=TRUE)
}
a<-table.row.end(a)
for (j in 1:nrows) {
a<-table.row.start(a)
mydum <- 'Estimates ('
mydum <- paste(mydum,j)
mydum <- paste(mydum,')')
a<-table.element(a,mydum, header=TRUE)
for (i in 1:ncols) {
a<-table.element(a,round(selection[[1]][j,i],4))
}
a<-table.row.end(a)
a<-table.row.start(a)
a<-table.element(a,'(p-val)', header=TRUE)
for (i in 1:ncols) {
mydum <- '('
mydum <- paste(mydum,round(selection[[2]][j,i],4),sep='')
mydum <- paste(mydum,')')
a<-table.element(a,mydum)
}
a<-table.row.end(a)
}
a<-table.end(a)
table.save(a,file='mytable.tab')
a<-table.start()
a<-table.row.start(a)
a<-table.element(a,'Estimated ARIMA Residuals', 1,TRUE)
a<-table.row.end(a)
a<-table.row.start(a)
a<-table.element(a,'Value', 1,TRUE)
a<-table.row.end(a)
for (i in (par4*par5+par3):length(resid)) {
a<-table.row.start(a)
a<-table.element(a,resid[i])
a<-table.row.end(a)
}
a<-table.end(a)
table.save(a,file='mytable1.tab')